
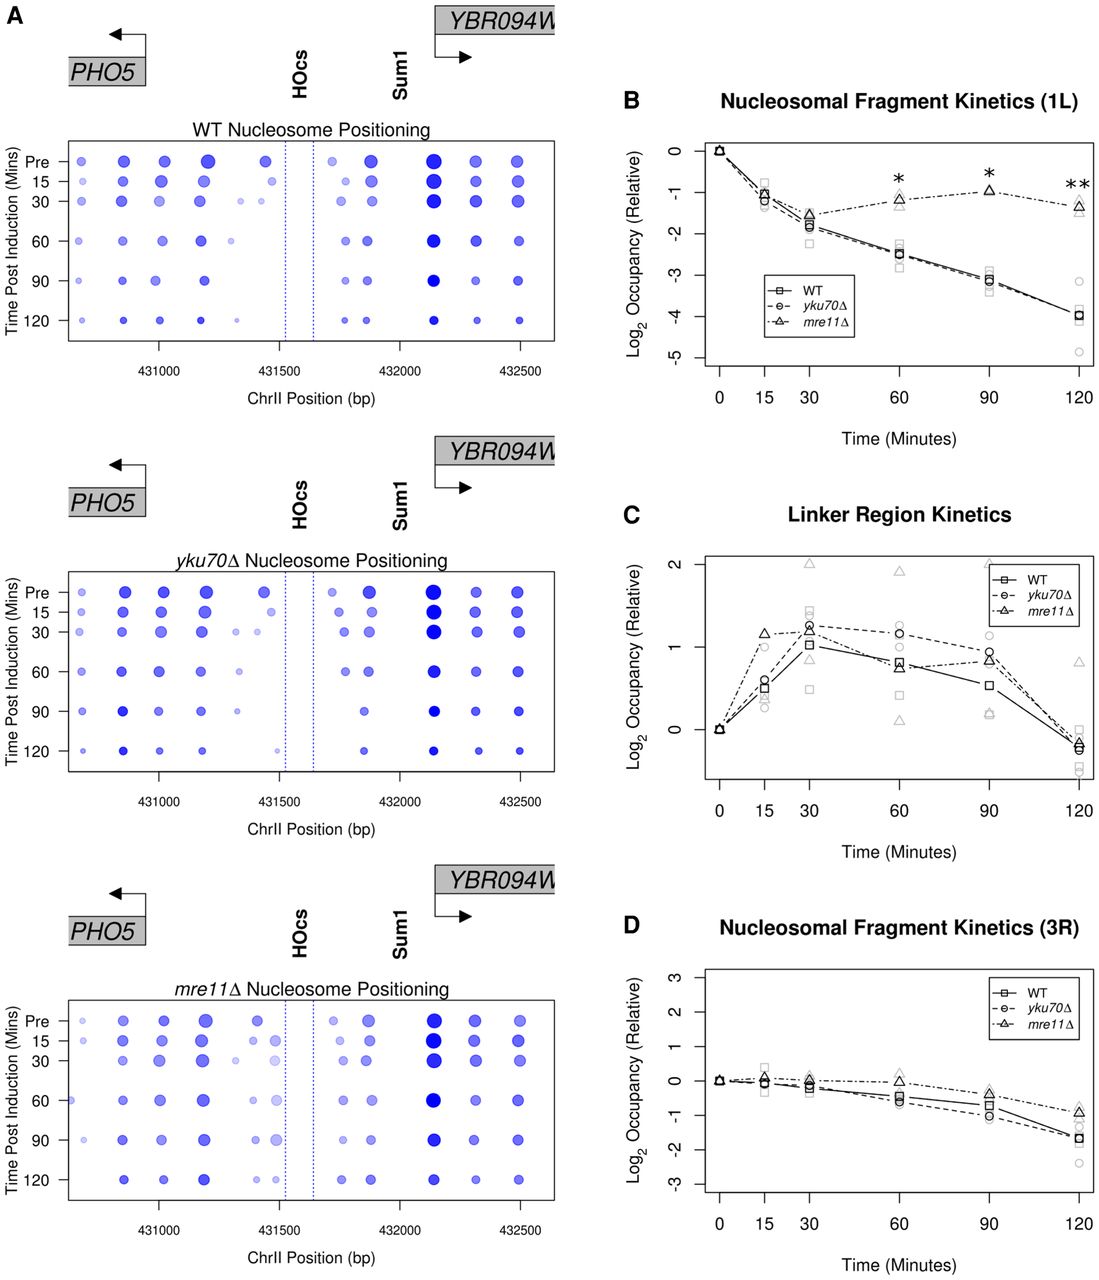
MRE11-independent and -dependent nucleosome dynamics at a DSB. (A) Pictographs depicting the chromatin changes near PHO5 following DSB induction. Increasing time is plotted downward on the y-axis and the boundaries of the 117-bp HO recognition site are denoted by dotted blue lines. (B) The FPKM corrected relative occupancy of the 1L nucleosome (Fig. 3, blue arrowhead) for the WT, yku70Δ, and mre11Δ mutant strains (*) P < 0.05, (**) P < 0.01, Student's t-test. n = 2. (C) Occupancy of the 1L-2L linker region was quantified as in B (Fig. 3; red arrowhead). (D) The same relative occupancy analysis performed in B is plotted for the 3R nucleosome (Fig. 3, gold arrowhead). This nucleosome is positioned immediately to the right of a predicted Sum1 protein binding site (Fig. 1A).


