
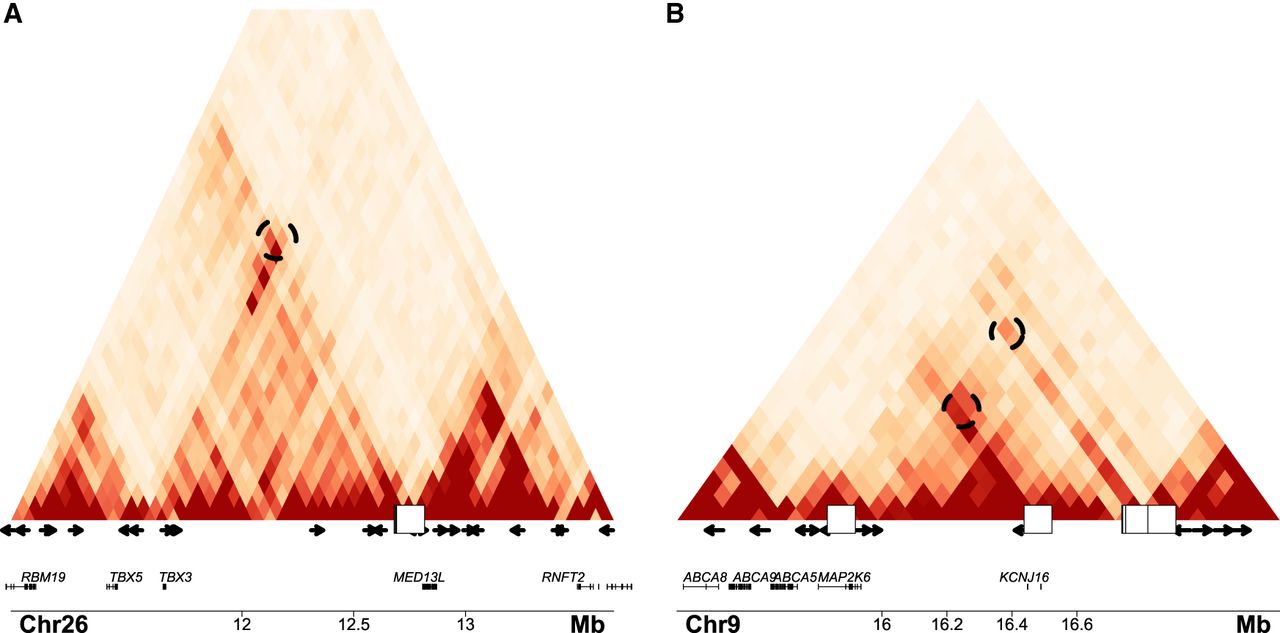
Figure 3.
Instances of CNVs associated with phenotypes overlapping chromatin contacts. (A,B) Hi-C interaction heat maps for significant contacts on Chromosomes 26 and 9. The white squares on the x-axis mark the position the GWAS hits. The arrows mark the position and directionality of the most significant CTCF motifs of the area. The dashed circles within the Hi-C plot mark the significant interactions involving the relevant genes and the associated CNVs.


