
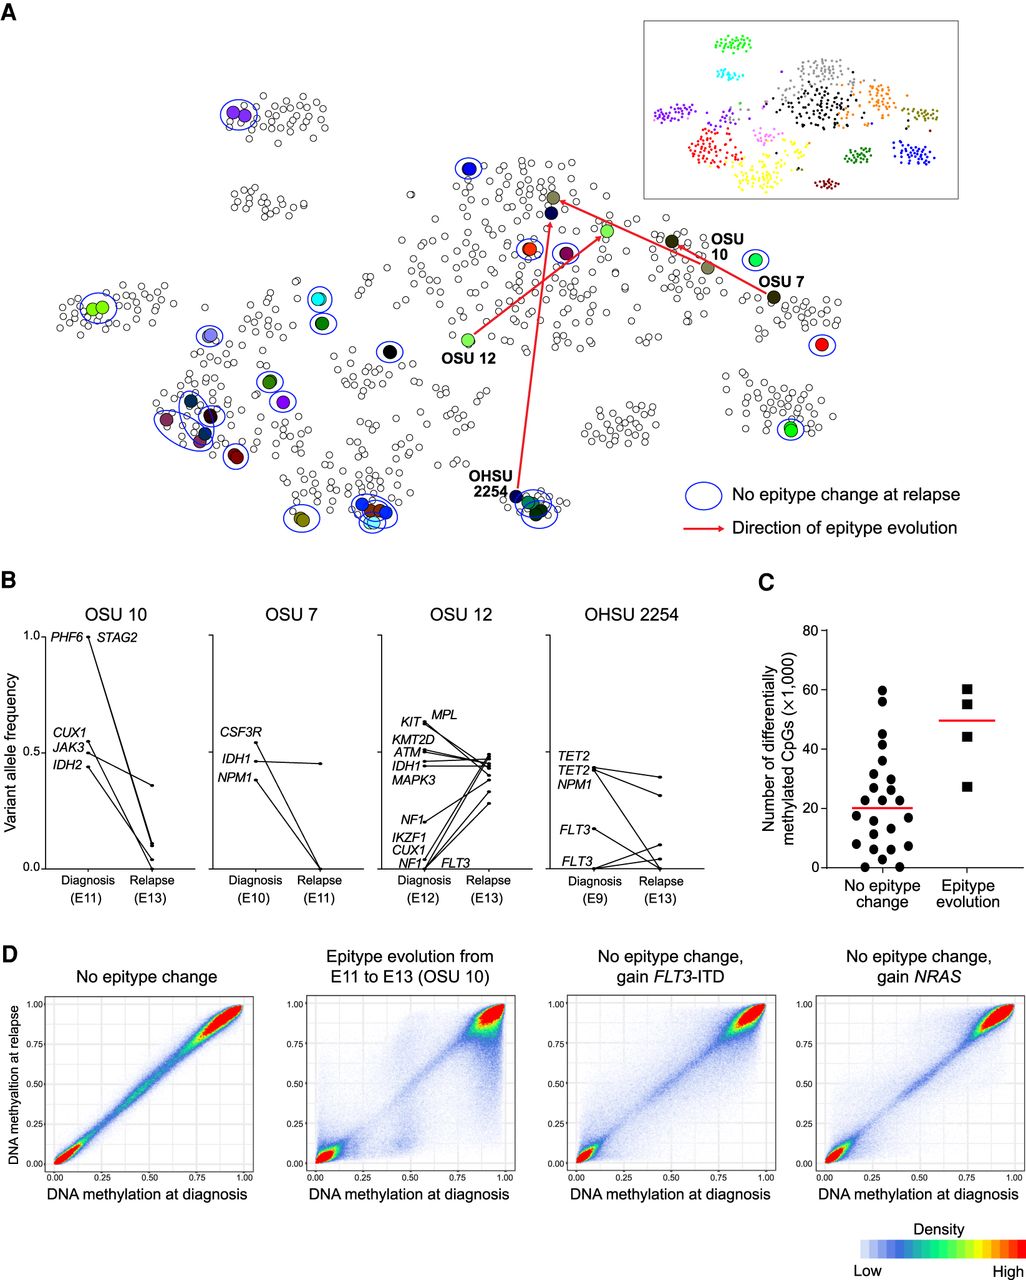
DNA methylation patterns are stable at relapse except in a minority of cases. (A) t-SNE plot of the AML epityping probe set including all AML samples along with paired diagnosis/relapse samples. The diagnosis and relapse sample (often completely overlapping) are indicated by the same color within pairs, and those pairs not changing epitype are circled in blue. Red arrows indicate pairs in which the relapse sample changed epitype. Epitypes are illustrated by standard colors in the inset. (B) Changes in mutant variant allele fraction between diagnosis and relapse in the 4/26 pairs that changed epigenetic epitype. (C) The number of probes that change by >20% between diagnosis and relapse; patients that showed change of epigenetic epitype are displayed separately. (D) Correlation of methylation values from all 426,862 probes at diagnosis and relapse in a representative sample that displayed a stable pattern, one that changed epitype, and two that remained within the same epitype but gained a signaling pathway mutation at relapse as indicated.


