
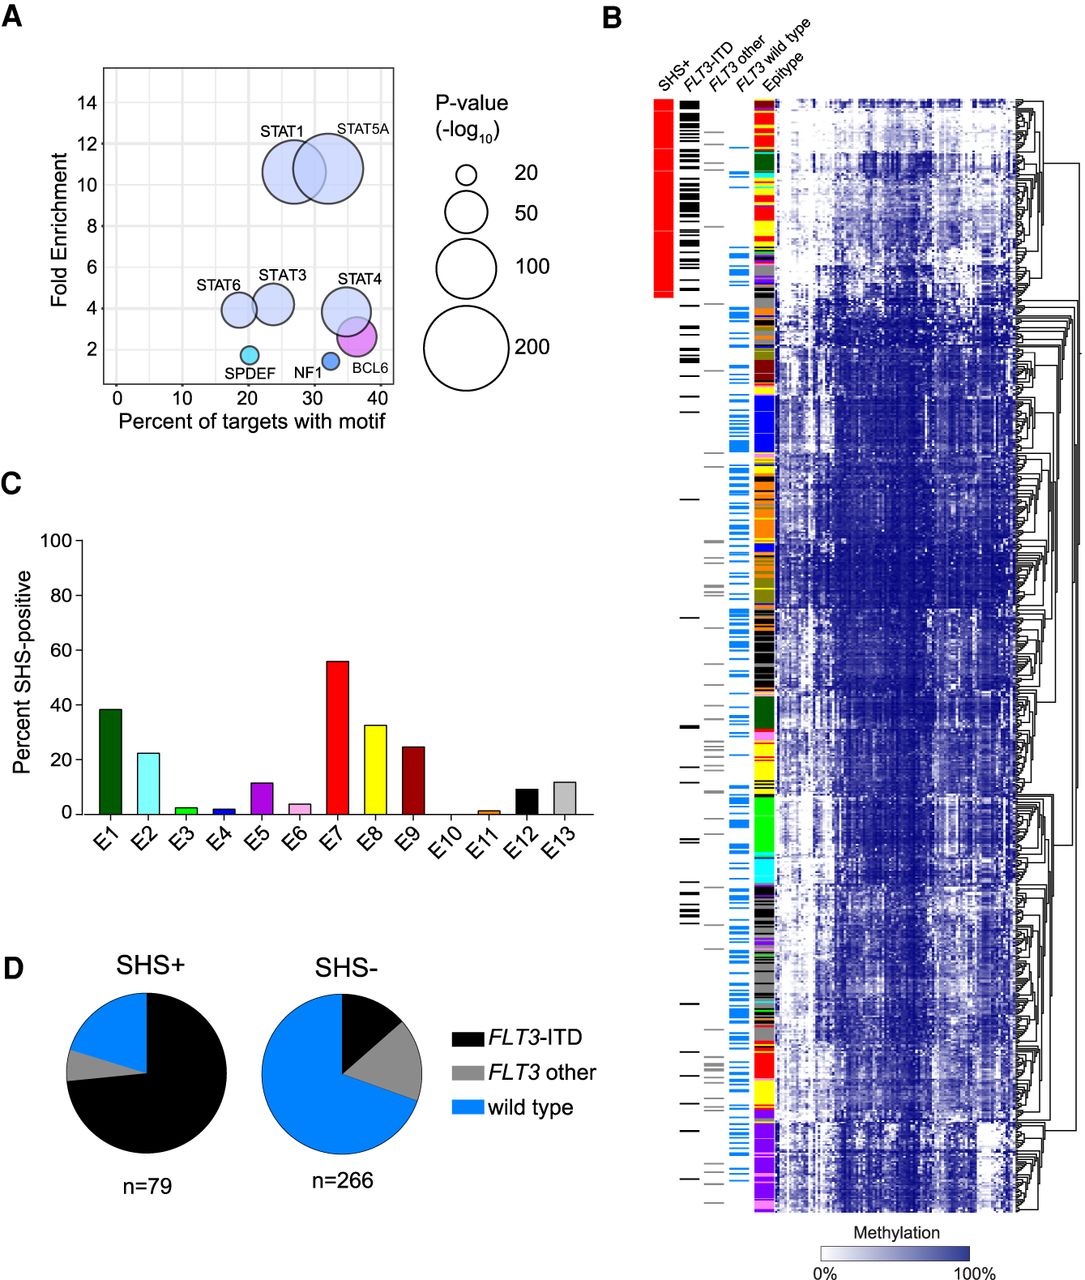
Figure 5.
A hypomethylation signature involving STAT is associated with FLT3-ITD mutations. (A) Bubble scatterplot of transcription factor motif enrichment in hypomethylated regions in FLT3-ITD-mutated AMLs. Bubble size corresponds to the P-value, and color corresponds to transcription factor family. (B) Heatmap of the STAT hypomethylation signature with samples arranged by hierarchical clustering. (C) Distribution of STAT hypomethylation signature-positive (SHS+) samples across AML epitypes. (D) Breakdown of FLT3 mutations in SHS+ (left) and SHS− (right) groups.


