
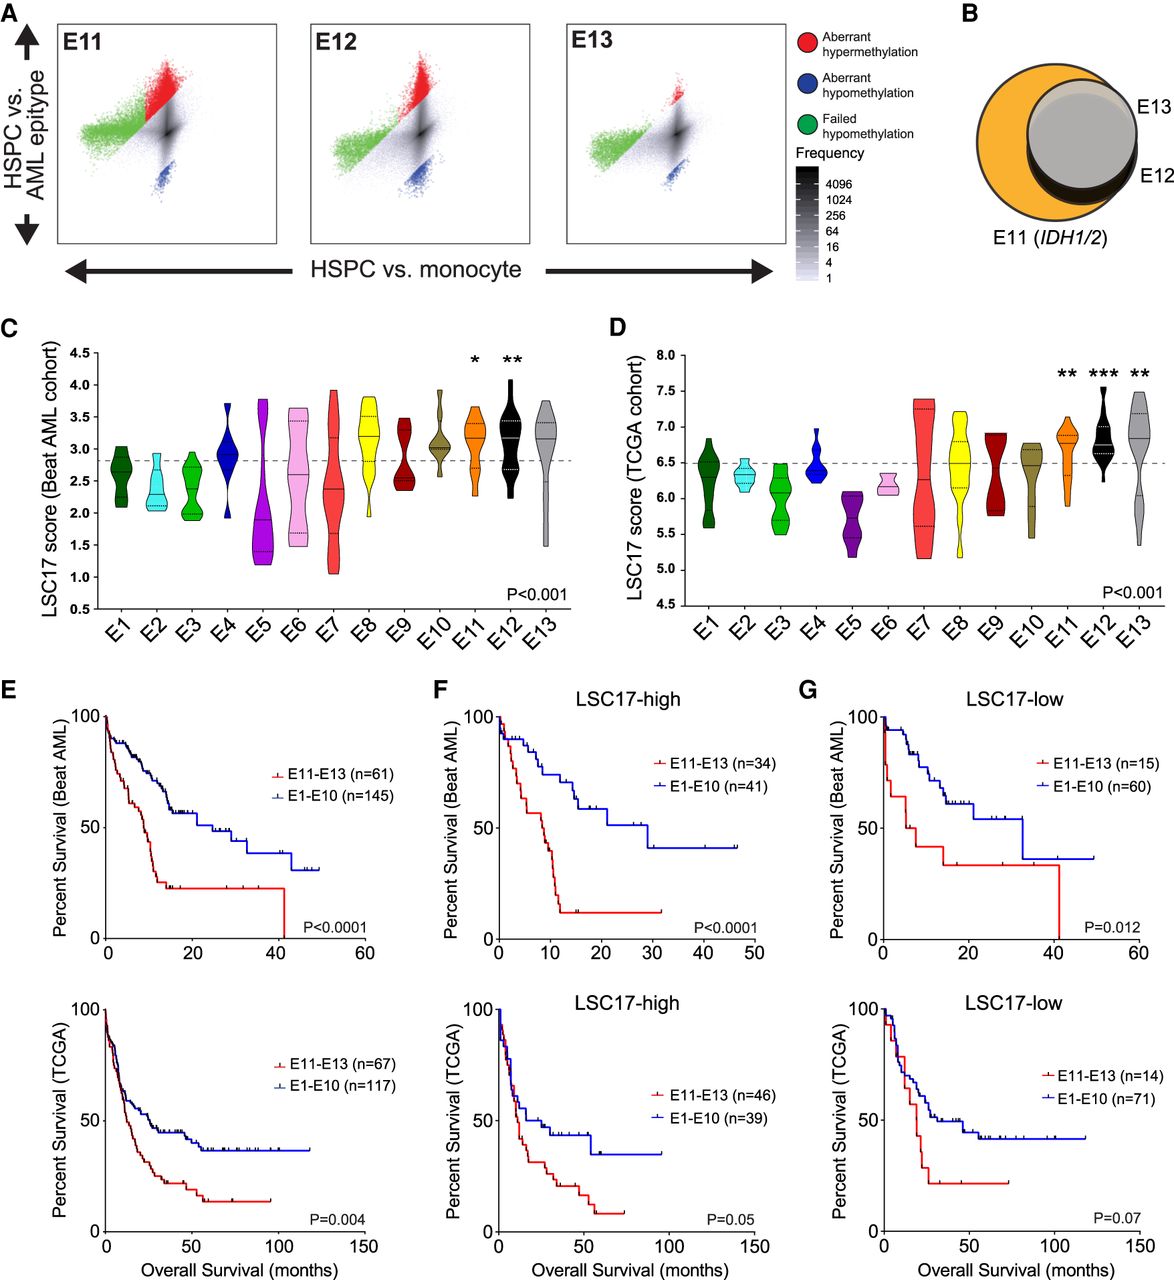
AML epitypes E11–E13 display stem-cell-like features. (A) Differential methylation scatterplots of E11–E13 highlight tumor-specific methylation changes. (B) Venn diagram showing overlap of failed hypomethylation in E11–E13. (C,D) LSC17 gene expression scores in the Beat AML (C) and the TCGA (D) cohort arranged by epitype. Cohort median value is indicated by the dotted line; significance evaluated by ANOVA test followed by comparison of E11–E13 individually versus E1–E10; adjusted P-values: (*) P < 0.05; (**) P < 0.01; (***) P < 0.001. (E) Kaplan-Meier analysis of overall survival of E11–E13 compared to the other epitypes (E1–E10) in the Beat AML and TCGA cohorts. (F,G) Kaplan-Meier analysis of overall survival of E11–E13 compared to the other epitypes in the Beat AML and TCGA cohorts following separation into LSC17-high (F) and LSC17-low (G) groups using median dichotomization indicated above in C and D, respectively.


