
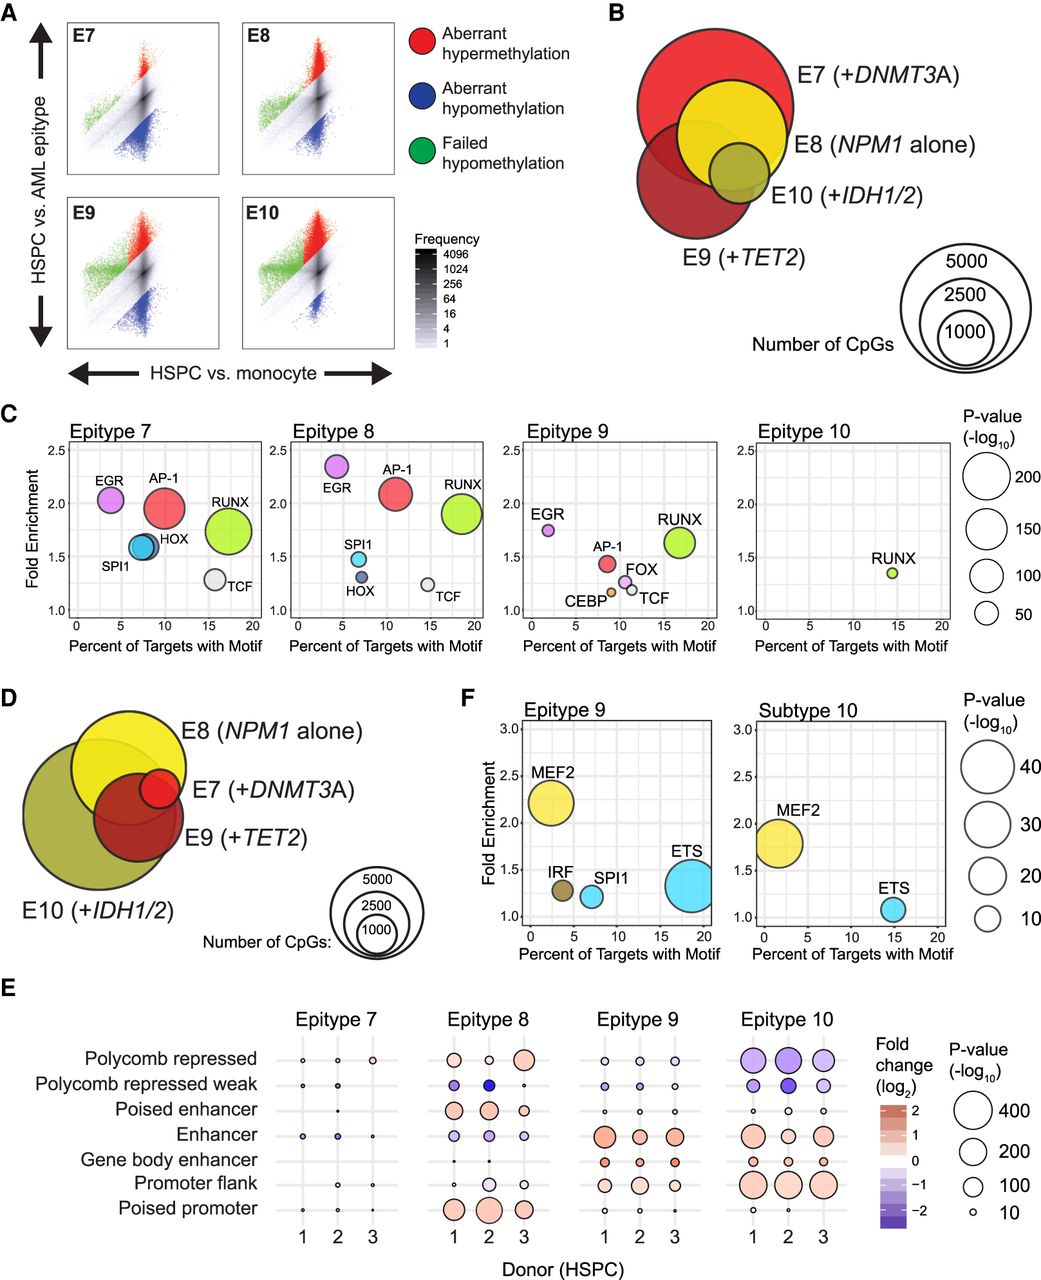
Analysis of tumor-specific methylation in the NPM1 constellation of epitypes (E7–E10). (A) Scatterplots comparing normal and tumor developmental methylation changes in E7–E10 highlight differential degrees of failed hypomethylation (green), aberrant hypermethylation (red), or aberrant hypomethylation (blue). (B) Venn diagram illustrating the numbers and overlap of aberrantly hypomethylated CpGs in E7–E10, with the dominant mutations within each epitype indicated (NPM1 alone or NPM1 plus a modifier mutation). (C) Bubble scatterplot of transcription factor motif enrichment in regions aberrantly hypomethylated in E7–E10. Bubble size corresponds to the P-value and color corresponds to transcription factor family. (D) Venn diagram of the aberrant hypermethylation in epitypes E7–E10. (E) Enrichment of aberrantly hypermethylated regions in selected chromatin states defined using the 15-state ChromHMM model in three independent HSPC samples. (F) Bubble scatterplot of transcription factor motif enrichment in regions aberrantly hypermethylated in epitypes 9 and 10.


