
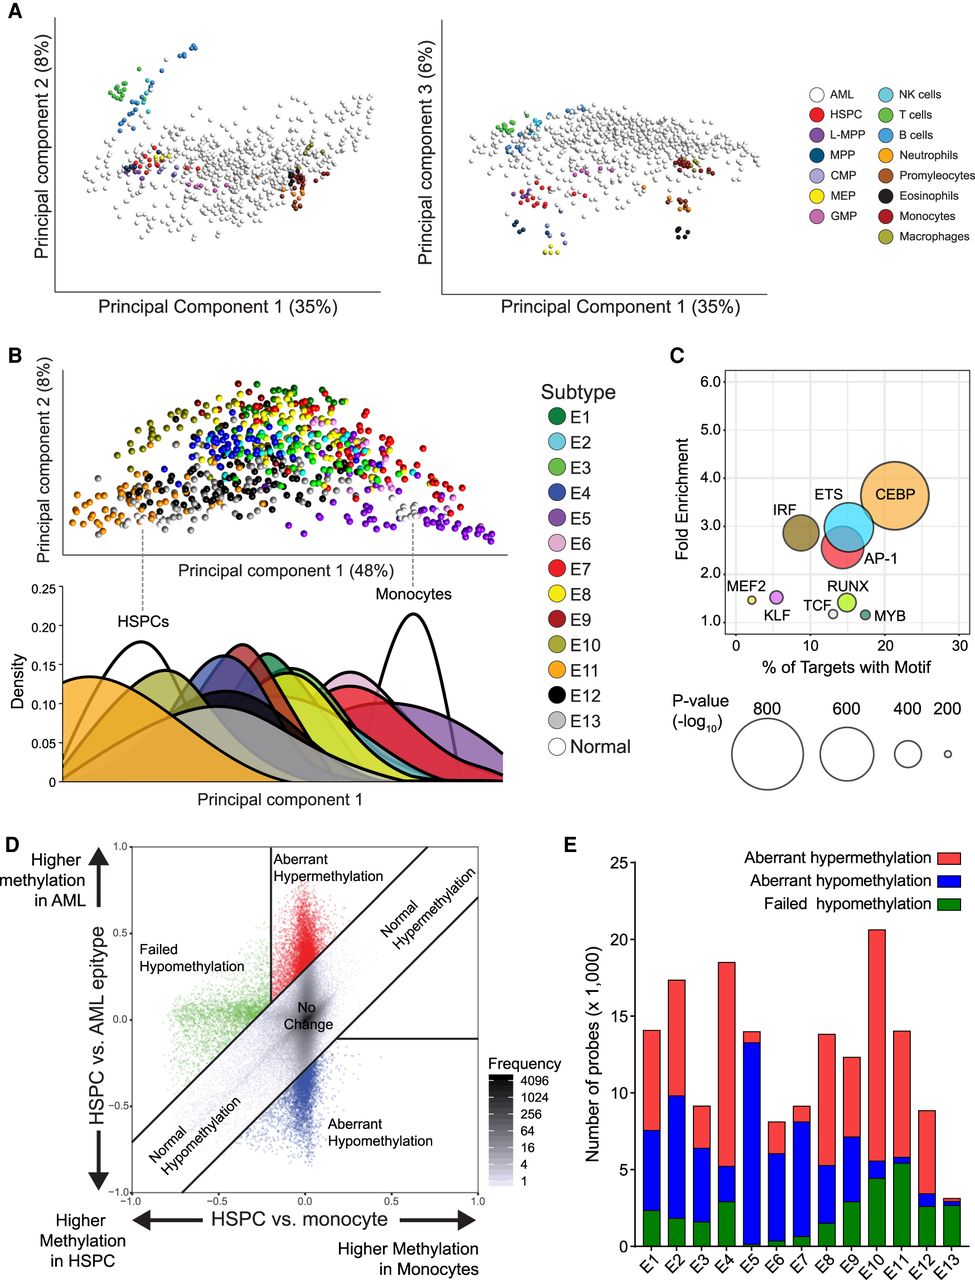
Assessment of DNA methylation associated with normal myeloid development enables identification of tumor-specific methylation. (A) Principal component analysis including healthy cell populations (colored) and AML samples (white) using the hematological developmental probe set (left, principal component [PC] 1 vs. PC2; right, PC1 vs. PC3). (B) Principal component analysis using a probe set of differentially methylated CpGs between HSPC and monocytes (white), including AML samples (colored by epitype). (Below) Density plot showing the distribution of samples with each epitype across PC1. (C) Bubble scatterplot of transcription factor motif enrichment in regions hypomethylated in monocytes compared to HSPC. Bubble size corresponds to the P-value, and color corresponds to transcription factor family. (D) A representative scatterplot simultaneously visualizing the DNA methylation differences in monocyte development (HSPCs to monocytes, x-axis) versus AML development using HSPCs as a reference (y-axis). Values represent average levels within HSPCs, monocytes, and AML epitype. Tumor-specific methylation changes are categorized as having aberrant hypermethylation (red) or aberrant hypomethylation (blue), separately from changes occurring in parallel with normal development (gray) or failing to occur as normally observed in monocytes (green). (E) Distribution of the tumor-specific methylation changes in each epitype. DNA methylation changes were compared simultaneously between normal and tumors (as shown in D) for all 13 epitypes.


