
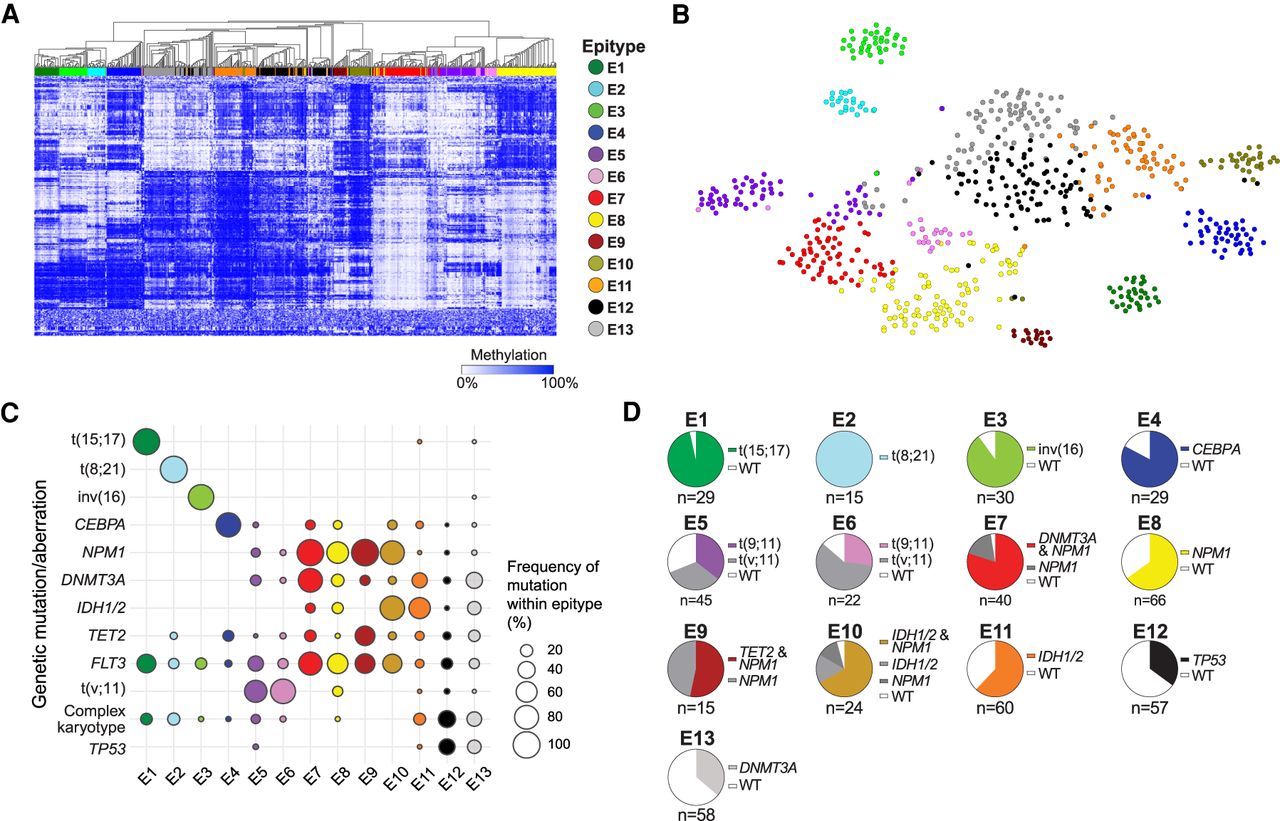
Figure 1.
Unsupervised clustering of 649 AML samples using DNA methylation and relationship with genetic mutations. (A) Heatmap of the 500 most variable CpGs across all samples organized by hierarchical clustering. Samples are annotated by epitype assignment using PAM clustering (colors). (B) The same 500 most variable displayed by t-SNE plot. (C) The distribution of the most common recurrent genetic aberrations in AML within the epitypes. Bubble size represents the percentage of patients within the epitype with the corresponding aberration. (D) Pie charts displaying the frequency of the most common (dominant mutation/combination) within each epitype.


