
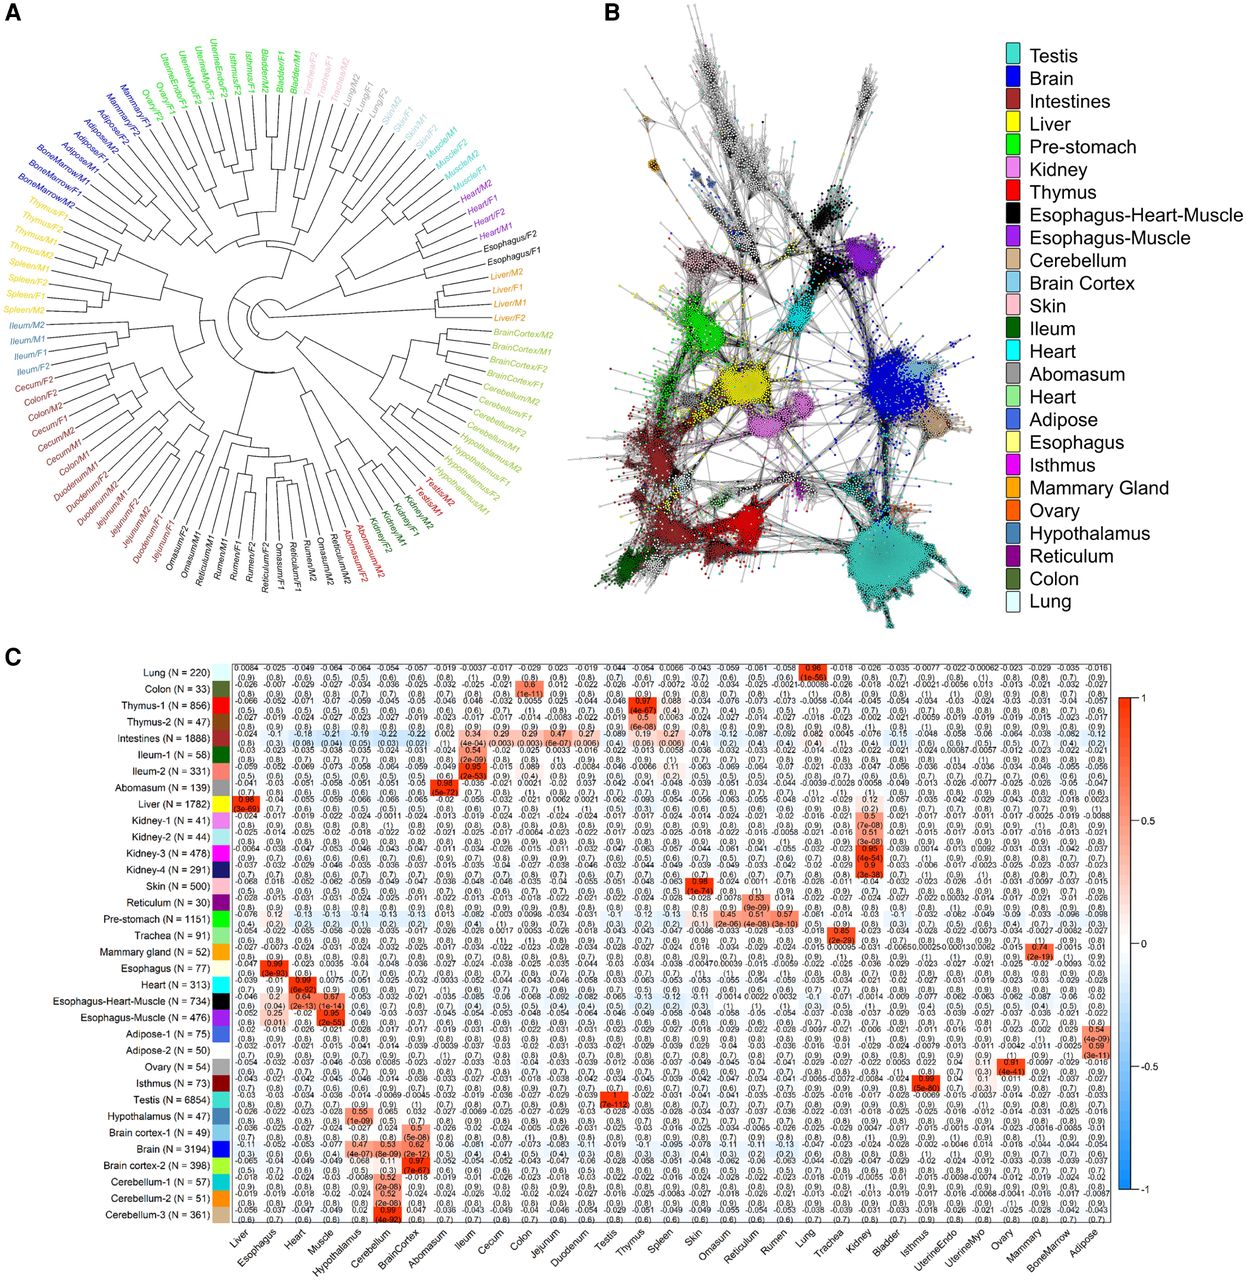
Promoter activity detected in 31 cattle tissues by RAMPAGE. (A) Sample dendrogram based on RAMPAGE signal. Samples grouped according to tissue, system, and higher-order structures. (B) TSC-to-TSC network generated based on Pearson's correlations. This network shows the diversity of tissue-specific promoters in our data set. Figure was generated using a minimum correlation of 0.75 in the Graphia v2.0 software (Freeman et al. 2020). (C) Modules of coexpressed TSCs indicating Pearson's correlations to each tissue and P-values. To validate the RAMPAGE signal from a quantitative perspective, we compared RAMPAGE counts to conventional RNA-seq gene counts in seven tissues from the same two male individuals. Estimates of gene expression by RAMPAGE were highly reproducible between biological replicates (average Pearson's R = 0.94, SD = 0.03) (Supplemental Table S4, Supplemental Fig. S9), consistent with the reproducibility of conventional RNA-seq (average Pearson's R = 0.98, SD = 0.01) (Supplemental Fig. S10). Absolute quantification of gene expression was comparable between the two techniques (average Pearson's R = 0.76, SD = 0.03) (Supplemental Figs. S11, S12), and detection of differentially expressed genes was strongly correlated between RNA-seq and RAMPAGE (average Pearson's R = 0.9, SD = 0.05) (Supplemental Fig. S13). Overall, these results suggest slight differences in global transcriptome measurement by RAMPAGE and RNA-seq, although both assays captured highly similar levels of differential gene expression.


