
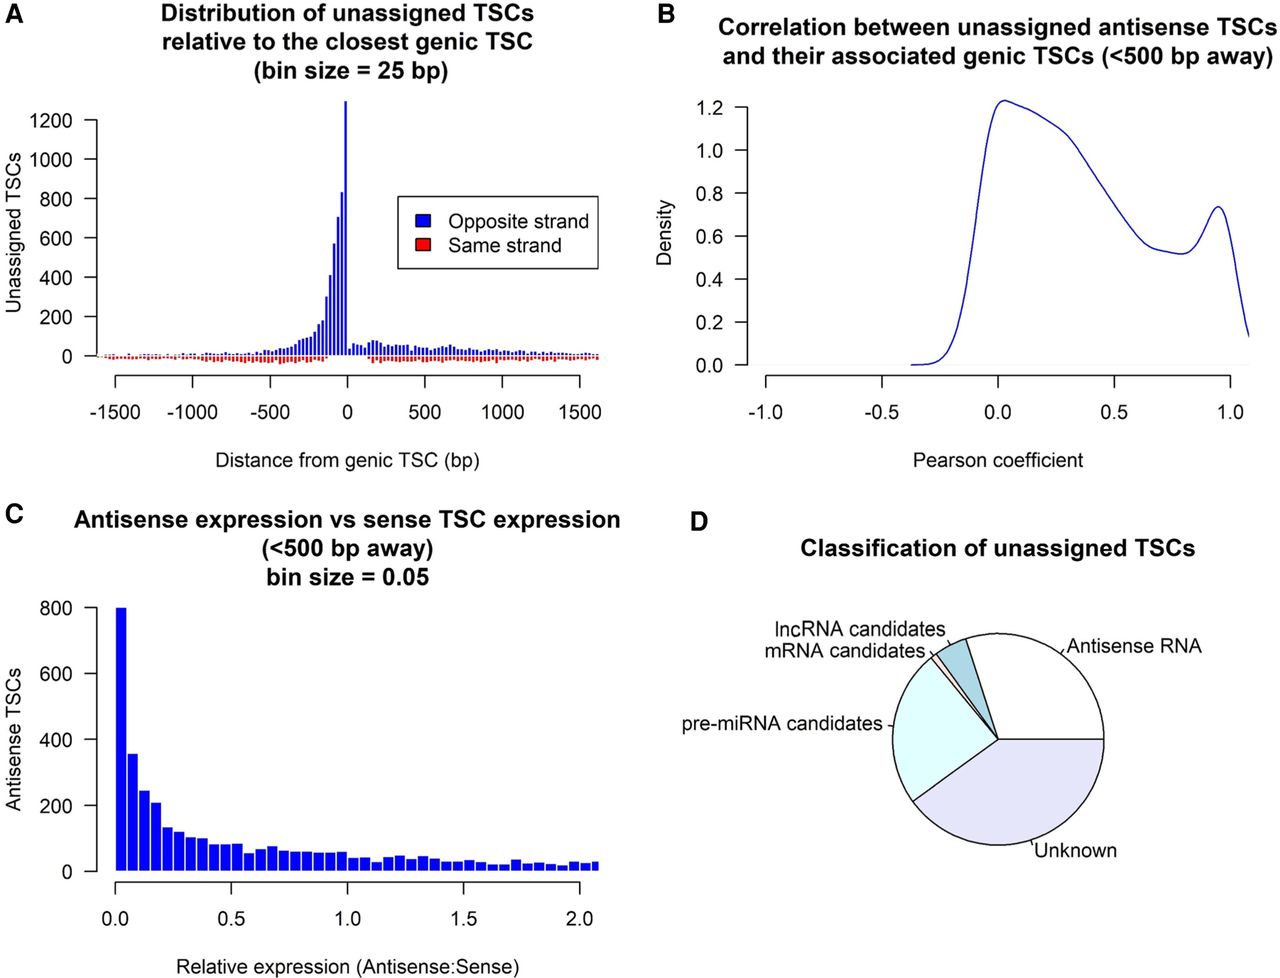
Figure 4.
Identification of unassigned TSCs through bioinformatic approaches. (A) Distance between unassigned TSCs and their nearest genic TSCs. A high number of elements localized within 500 bp upstream of genic TSCs but on the opposite strand. (B) Correlation of expression from antisense TSCs (CPM > 3) with expression from sense TSCs. (C) Expression of the antisense variant (CPM > 3) relative to the sense variant. (D) Putative roles attributed to unassigned TSCs.


