
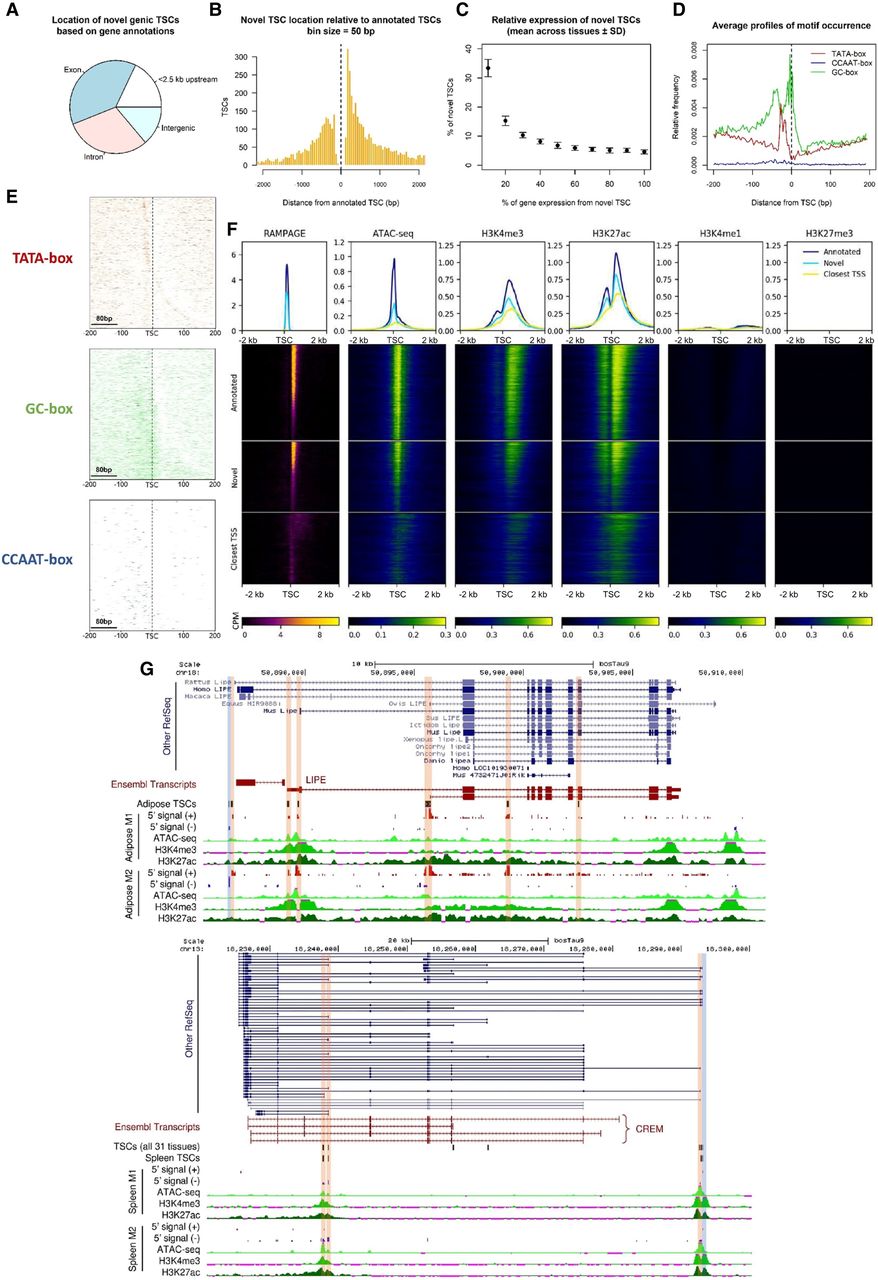
Novel promoters identified by RAMPAGE. (A) Location of novel TSCs according to gene annotations. (B) Histogram of the distance between novel TSCs and annotated TSCs. (C) Relative expression of novel TSCs. (D) Profiles of motif occurrence for TATA-, CCAAT-, and GC-boxes around novel TSCs (±200 bp). (E) Motif density maps for TATA-, CCAAT-, and GC-boxes around novel TSCs (±200 bp). TSCs are ordered ascendingly by size; that is, upper rows represent narrow TSCs. The zero coordinate represents the 5′-end of the TSC. Narrow TSCs were particularly enriched with TATA-box motifs and broad TSCs were enriched with GC-box motifs. (F) Epigenetic marks at reported and novel TSCs. The co-occurrence of chromatin accessibility and transcriptional activation marks (H3K4me3, H3K27ac) at novel TSCs, as well as the absence of poised enhancer and repressive marks (H3K4me1, H3K27me3), suggested these TSCs constituted promoter regions. The fuzzy signal observed around the closest annotated TSSs evidenced the absence of annotation for these novel elements. The data shown in the figure correspond to the lung-M2 sample (>3 CPM). Heatmaps are colored according to CPM values. (G) Novel TSCs for the LIPE and CREM genes. Most of the new variants are supported by annotations from other species. Antisense TSCs were marked with blue to distinguish them from sense TSCs (orange).


