
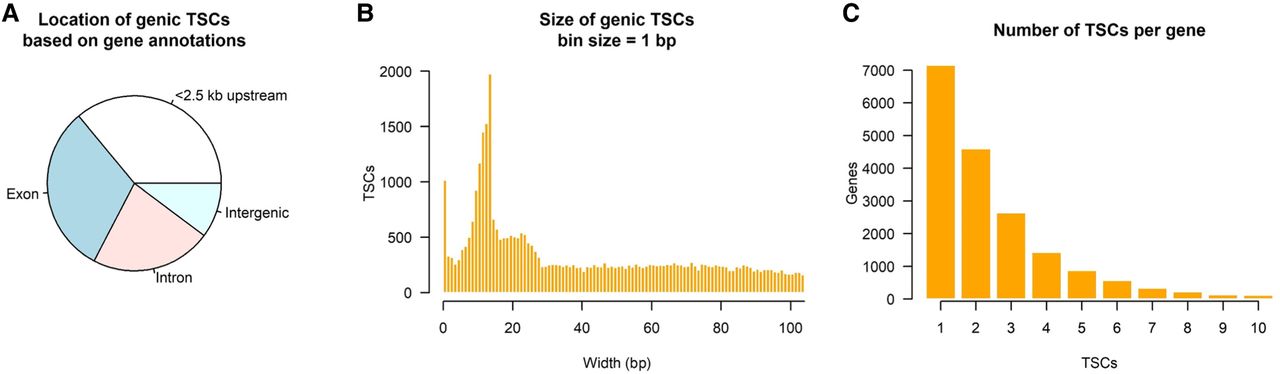
Figure 2.
Genic TSCs identified by RAMPAGE sequencing. (A) Location of genic TSCs according to gene annotations. (B) Histogram of TSC size. (C) Use of multiple TSCs for the same gene. Genes with more than 10 TSCs were excluded from the plot as they were likely affected by technical artifacts.


