
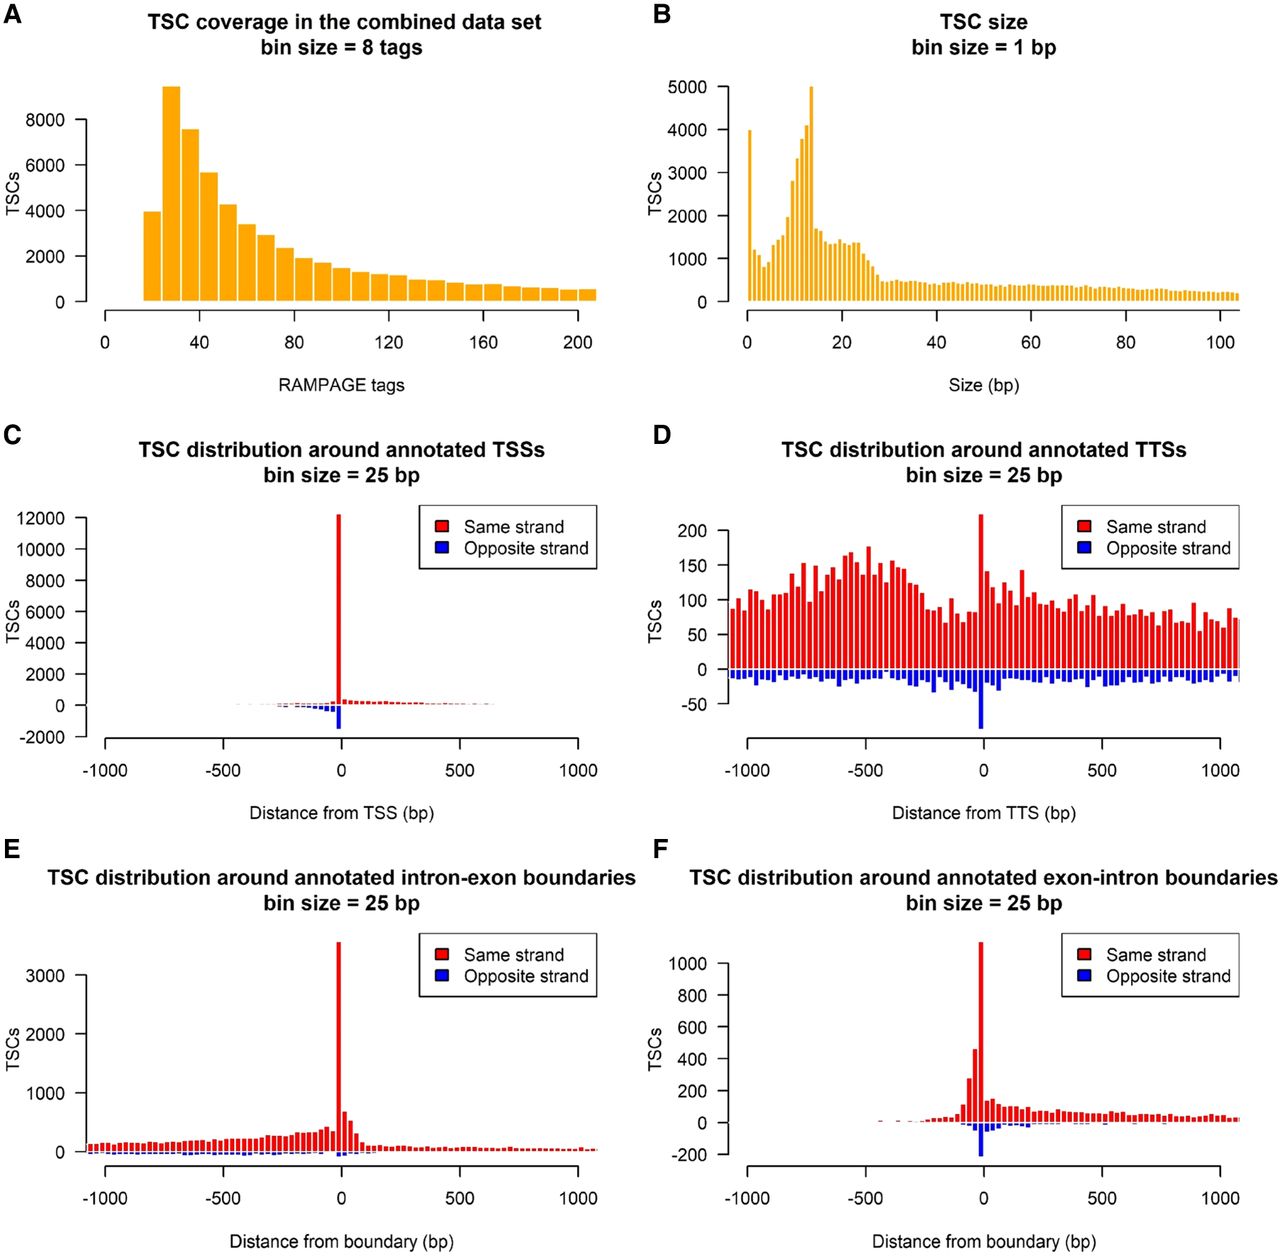
Identification of promoters by RAMPAGE. (A) Tag coverage in TSCs identified in the combined data set. (B) TSC size distribution for the whole data set. (C) Histogram of the distance between TSCs and their nearest annotated TSS. (D) Histogram of the distance between TSC and the nearest annotated TTS. (E) Histogram of the distance between TSCs and intron–exon boundaries. Only intron–exon boundaries not overlapping with any annotated TSSs were considered. (F) Histogram of the distance between TSCs and exon–intron boundaries. For visualization, exon–intron boundaries corresponding to the end of the first exon were ignored, as TSCs tended to group immediately upstream of these boundaries and interfere with the visualization.


