
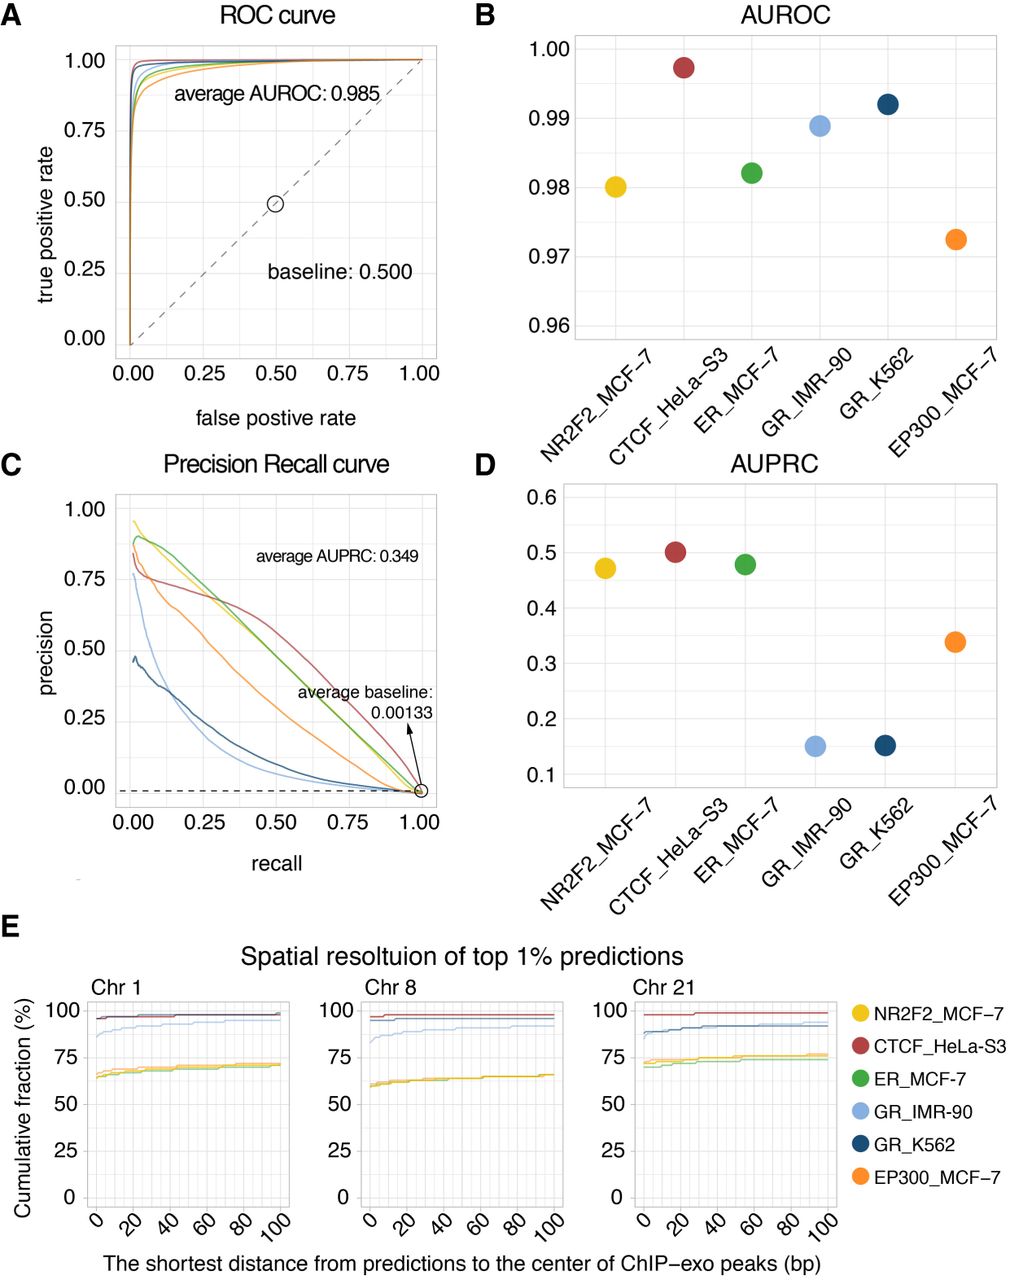
Evaluating Leopard predictions based on TF binding profiles from ChIP-exo experiments. (A) The ROC curves and (B) the AUROCs of the six protein–cell type combinations. Different colors represent different combinations. (C) The PR curves and (D) AUPRCs of the six protein–cell type combinations. The average AUPRC baseline score of random prediction is 0.00133 shown as the horizontal dashed line. These results were calculated on the three testing chromosomes (Chr 1, Chr 8, and Chr 21). (E) The spatial resolution is defined as the shortest distance (in bp) between Leopard predictions and the center of ChIP-exo peaks. We focused on the top 1% predictions and calculated the cumulative fractions of peaks with different spatial resolutions, ranging from 0 bp to 100 bp in three testing chromosomes.


