
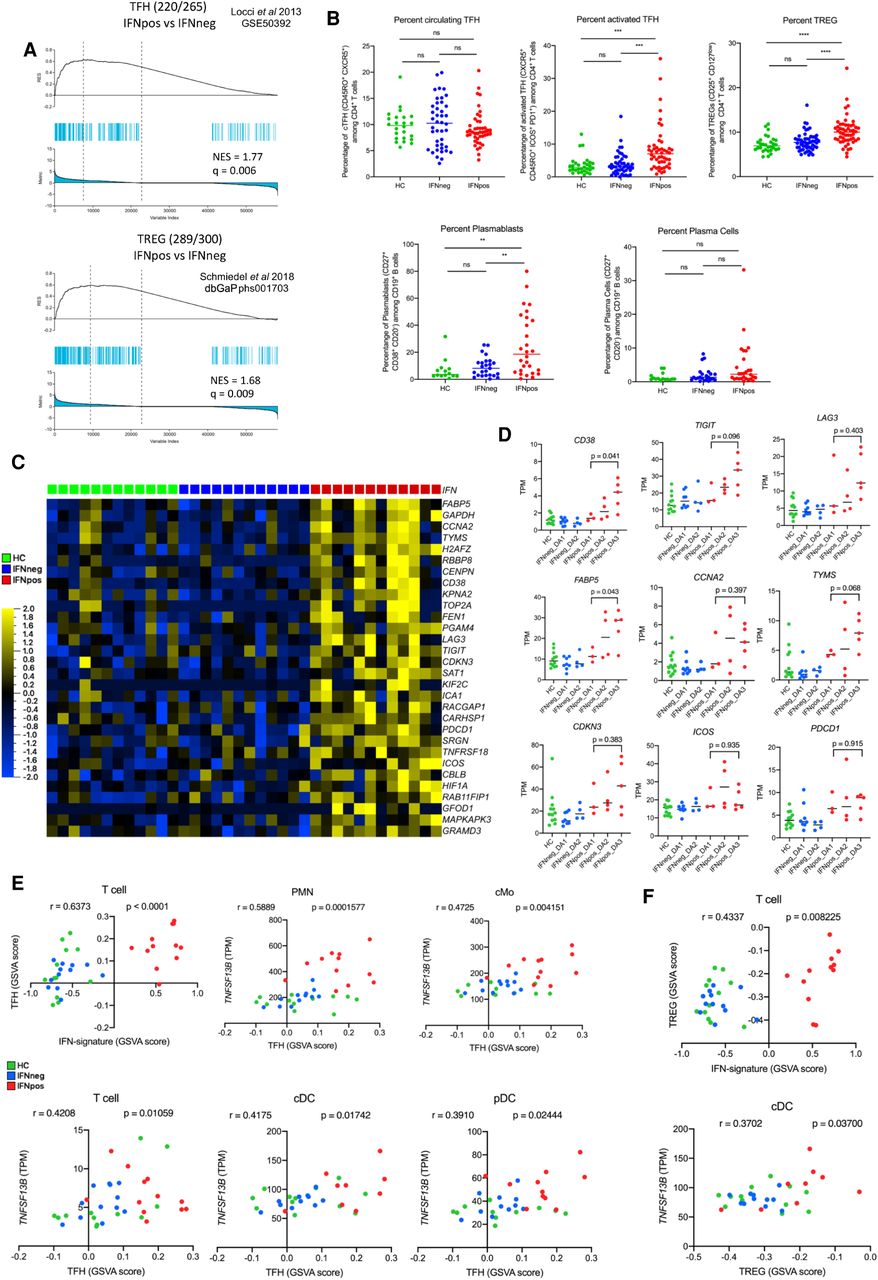
Enrichment of TFH and TREG signatures in IFNpos patients in correlation with TNFSF13B expression from myeloid cells. (A) Gene set enrichment analysis (GSEA) of TFH (top) and TREG (bottom) gene sets in the transcriptome of IFNpos versus IFNneg in T cells, presented as running enrichment score (RES) for the gene set, from most overrepresented genes on the left to the most underrepresented on the right. The values above the plot represent the normalized enrichment score (NES) and multiple testing-corrected significance value (Kolmogorov–Smirnov test). The source of the gene set is also provided. (B) Scatter dot-plots show the percentages of circulating TFH in CD3+ CD4+ T cells (top left), activated TFH in CD3+, CD4+, CXCR5+, CD45RO+ cTFH (top center), TREG in CD3+, CD4+ T cells (top right), plasmablasts (bottom left), and plasma cells in CD19+ B cells (bottom right) in healthy donor, IFNneg, and IFNpos patient blood. Data from all patient visits are included. Samples with <50 cells in the gate of interest were excluded. Differences between IFNpos and IFNneg were calculated using an unpaired t-test, and statistical significance (P-value) levels are shown in each plot. (ns) Not significant, (**) <0.005, (***) <0.0005, (****) <0.0001. The detailed gating strategies are provided in Supplemental Figure S9. (C) Expression of top 30 TFH-related genes within the total CD3+ T cell transcriptome, where each gene is presented as row-wise z-scores of TPM values in IFNpos (red), IFNneg (blue), and HC (green); each column represents an individual patient. (D) Individual expression plots for known TFH-related genes divided by IFN response status as well as SLEDAI categories. The provided P-values are based on an unpaired t-test (two-tailed). (E) The top left plot shows Spearman's correlation between GSVA scores derived either from IFN-20 genes (x-axis) or from the TFH gene set (y-axis) for T cell gene expression data. The rest of the plots show TFH gene set GSVA score versus TNFSF13B (BAFF) expression in five cell types with a significant correlation between the two axes. (F) Similar plots to those in E using GSVA scores from the TREG gene set.


