
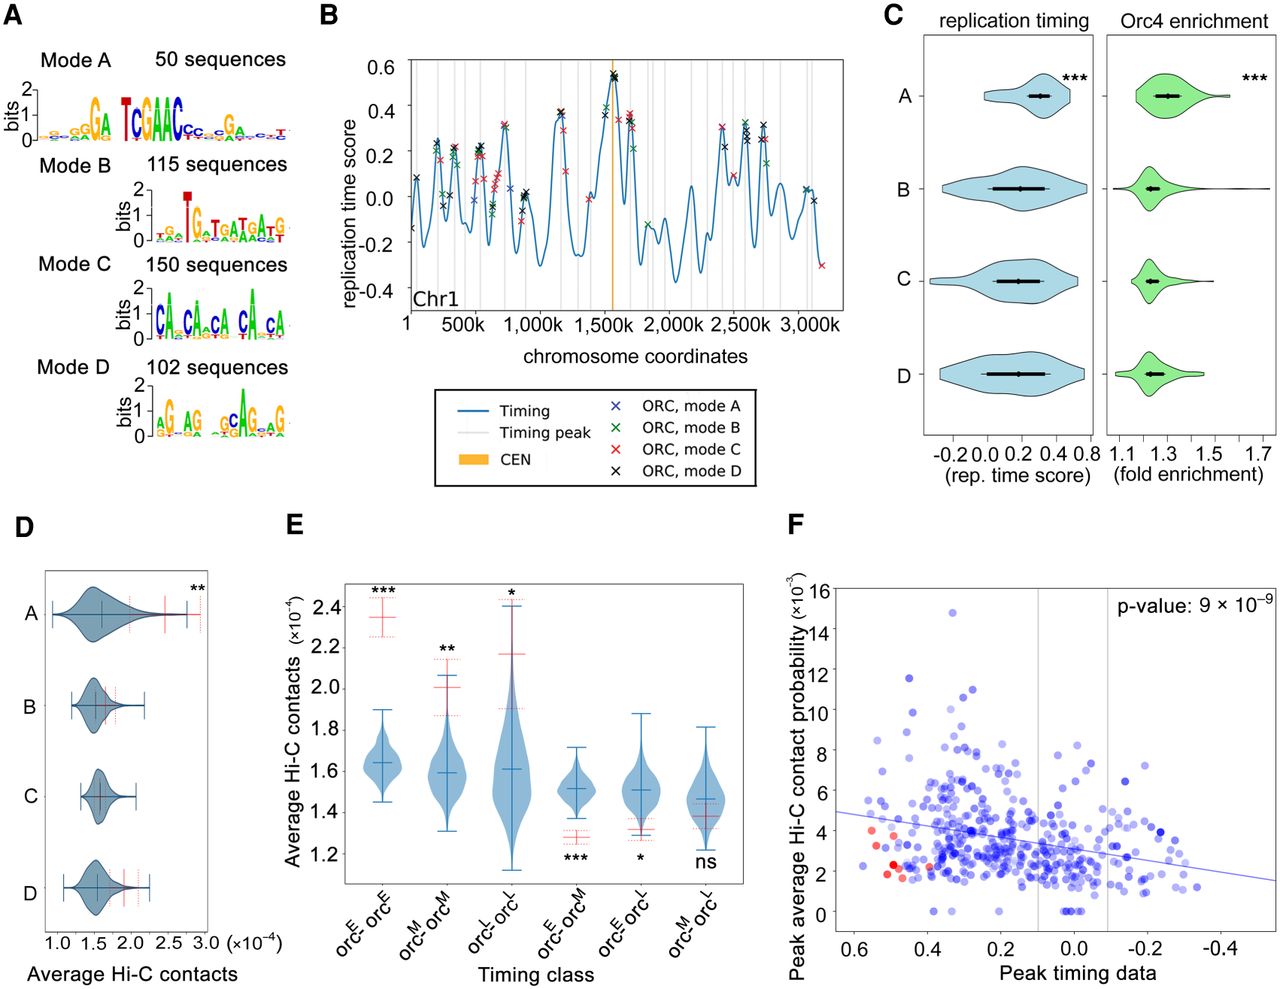
Orc4 is associated with four different DNA binding modes that are spatiotemporally located across the genome. (A) The four different modes identified by DIVERSITY (modes A, B, C, D) and their distribution across the 414 Orc4 binding regions in the C. albicans genome have been listed. (B) Orc4 ChIP-seq peaks denoted as asterisks, colored according to the four modes identified by DIVERSITY, were overlaid on the replication timing profile of Chr 1 in C. albicans from a previous study (Koren et al. 2010). A higher time score indicates replication at early S phase. Color-coded stars indicate each of the four motifs identified by DIVERSITY, which covers all the chromosomal sites. Light gray lines indicate local maxima in replication time. (CEN) Centromeres. (C) Violin plots depicting the replication timing scores (blue) (Koren et al. 2010) and Orc4 enrichment (green) of all the Orc4 peaks classified according to each of the four modes. (***) P-value < 0.0001. (D) Average Hi-C interactions (Burrack et al. 2016) of Orc4 peaks with other peaks in the same mode. Solid red indicates mean; dotted red, standard error; violins are from 1000 sets of randomized data (randomly selected genomic regions with the same size and chromosomal distribution as the peaks in that mode). (**) P-value < 0.001. (E) Mean Hi-C interactions (solid red) with standard error (dotted red) within and across each of the three timing classes (orcE, orcM, and orcL). These indicated higher interaction values within orcE and within orcL domains. Blue violins indicate mean interactions across 1000 randomizations, as in D. (***) P-value < 0.0001; (**) P-value < 0.001; (*) P-value < 0.01; (ns) P-value > 0.5. (F) A scatter plot of Hi-C contacts, replication timing, and Orc4 fold enrichment values of Orc4 binding regions. Each blue/red dot is an individual Orc4 peak, with its color intensity corresponding to its ChIP-seq enrichment value; red dots are peaks overlapping eight centromeres. The y-axis (peak average Hi-C contacts) represents the average of 10 best contacts for each peak of Orc4. The Pearson correlation coefficient is 0.27.


