
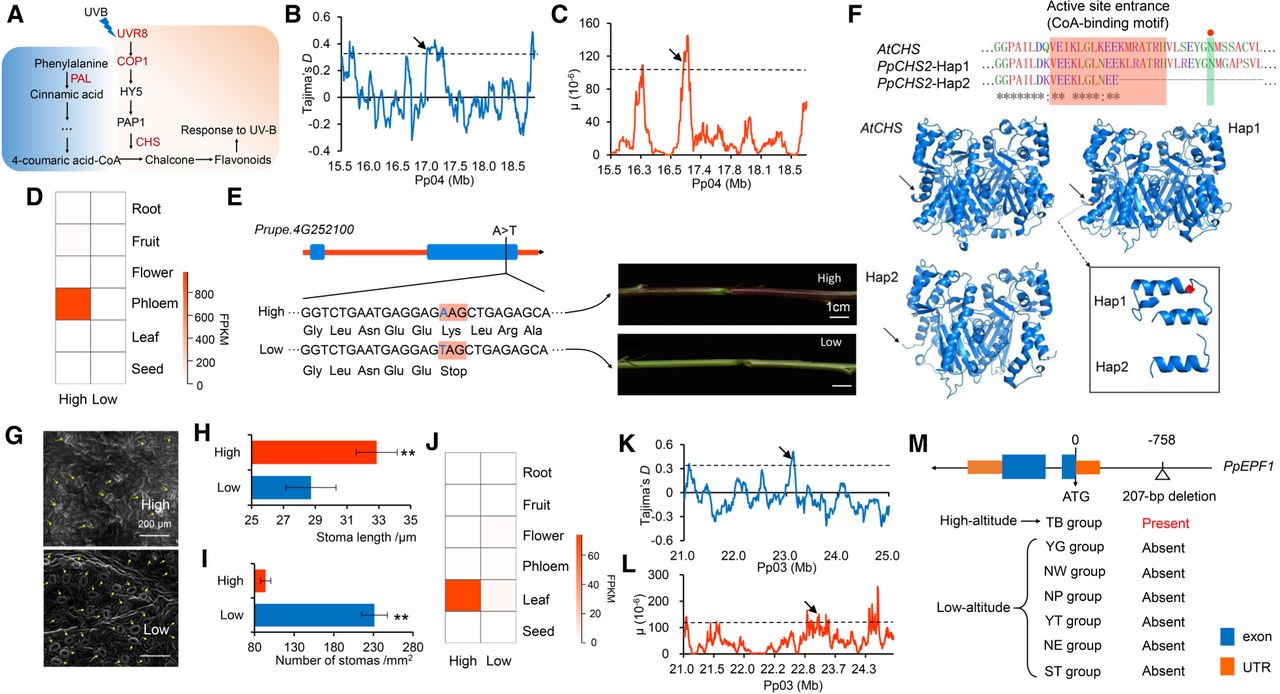
Genomic regions and candidate genes related to high-altitude adaptation of peach. (A) Pathway related to plant response to UVB. Genes under selection are highlighted in red. (B,C) Distribution of Tajima's D (B) and μ statistic (C) in the region around PpCHS2 (Prupe.4G252100) on Chromosome 4 (15.5–19.0 Mb). The dashed horizontal lines indicate a threshold of the top 5% for Tajima's D (≥0.36) and μ test (≥1.07). Arrows point to PpCHS2. (D) Heat map of expression profiles of PpCHS2 in different tissues in low- and high-altitude accessions. (E) A candidate stop-gained SNP in PpCHS2 that is associated with high-altitude adaption and new shoot colors in accessions from low and high altitudes. (F) Effects of stop-gained SNP on protein structure of CHS. 3D structure of CHS protein was obtained from Swiss-Prot. The red shadow represents the CoA-binding motif. The green shadow represents one of the conserved enzyme active site. (G) Scanning electron microscopy (SEM) of stomata from leaves of high- and low-altitude accessions. The magnification is 800×. (H,I) Stomatal length (H) and stomatal density (I) in high- and low-altitude accessions. (**) P < 0.01. (J) Heat map of expression profiles of PpEPF1 in different tissues in accessions from low and high altitudes. (K,L) Distribution of Tajima's D (K) and μ values (L) in a region around PpEPF1 (Prupe.3G235800) on Chromosome 3 (21.0–25.0 Mb). The dashed horizontal lines indicate a threshold of the top 5% for Tajima's D (≥0.36) and μ test (≥1.07). Arrows point to PpEPF1. (M) Structure of PpEPF1 and the position of the 207-bp deletion. The presence and absence of the 207-bp deletion in the seven groups are given.


