
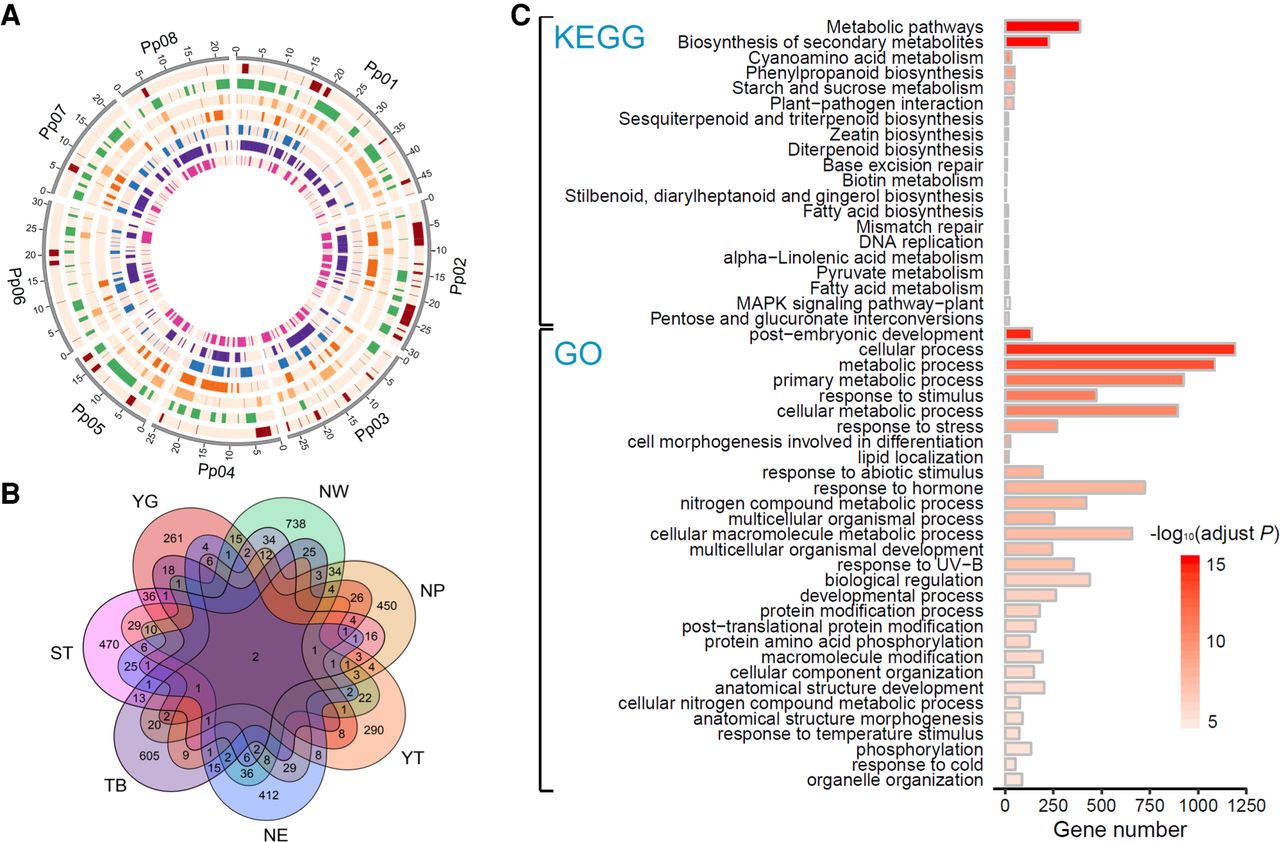
Summary of genes under selection for the seven peach groups. (A) Circos plot of the selective sweeps for the seven groups (Supplemental Table S4). The Circos plot in SVG format is available at figshare (https://figshare.com/articles/figure/Genomic_analyses_provide_insights_into_peach_local_adaptation_and_responses_to_climate_change/13158482). The outer track represents the eight chromosomes of the peach genome. The seven inner tracks depict the distribution of selective sweeps across the peach genome in YG, NW, NP, YT, NE, TB, and ST groups, respectively (from the outside inward). (B) Venn diagram showing the number of genes under selection in the seven groups. (C) Overrepresented Gene Ontology (GO) terms and Kyoto Encyclopedia of Genes and Genomes (KEGG) pathways in overall selection regions. Only the top 20 and 30 most overrepresented KEGG pathways and GO terms are shown. (YG) Yun-gui plateau, (NW) Northwest China, (NP) North Plain China, (YT) Yangtze River Middle and Backward, (NE) Northeast China, (TB) Tibet plateau, (ST) South China Subtropical.


