
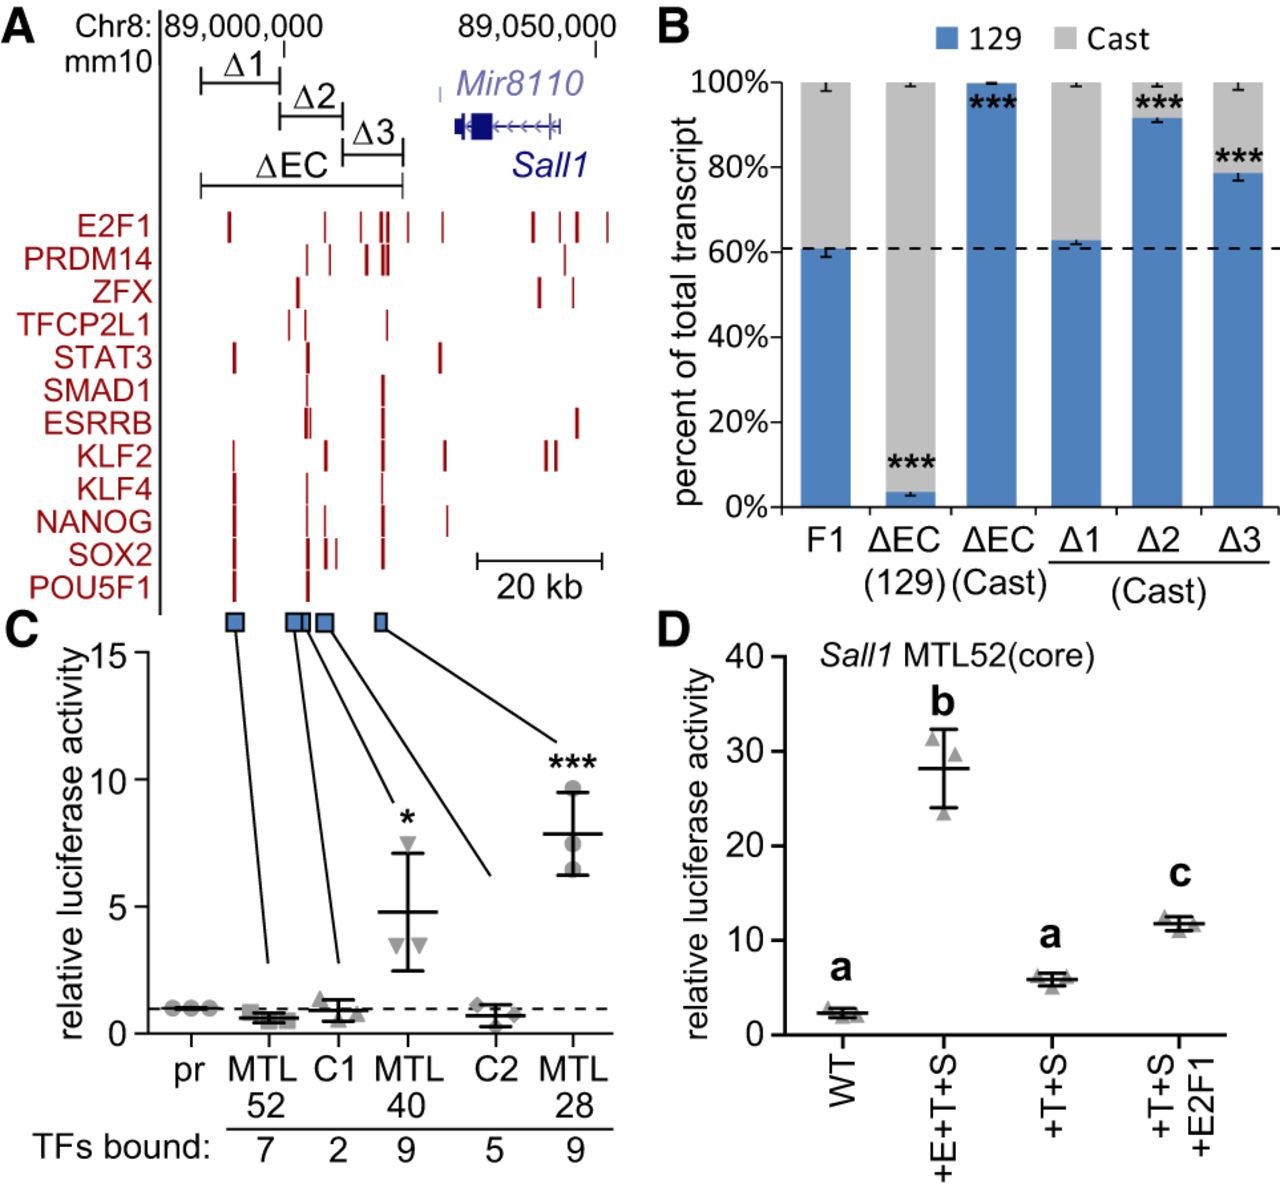
Addition of three different transcription factor binding sequences confers activity to an inactive region bound by six transcription factors. (A) Transcription factor–bound regions in the Sall1 locus from ChIP-seq (red bars) are displayed on the mm10 assembly of the UCSC Genome Browser. At the top, CRISPR deleted regions (ΔEC, Δ1, Δ2, Δ3) are displayed. At the bottom, regions tested for enhancer activity are displayed (blue bars). (B) Sall1 expression in wild-type F1 clones (F1) compared to clones with the indicated deletion. Allele-specific primers detect 129 or Cast RNA in RT-qPCR. Expression for each allele is shown relative to the total. Error bars represent SEM. n ≥ 3 biological replicates. (***) P < 0.001; significant differences from the F1 values. In C,D, error bars represent the standard deviation. n ≥ 3 biological replicates. (C) Luciferase activity at control (C1, C2) regions and multiple transcription factor–bound loci (MTL) 52, 40, and 28 kb downstream from Sall1. Significant differences from pr (promoter only) were determined by t-test and are indicated by (*) P < 0.05, (***) P < 0.001. (D) Luciferase activity for wild-type (WT) MTL52 core transcription factor–bound region, MTL52 core with ESRRB, TFCP2L1, and SMAD3 (+E+T+S) motifs mutated to the consensus TFBS sequence. From +E+T+S, ESRRB (+T+S) was removed. E2F1 was added to +T+S (+T+S+E2F1). Groups determined by one-way ANOVA to be significantly different (P < 0.05) are labeled with different letters.


