
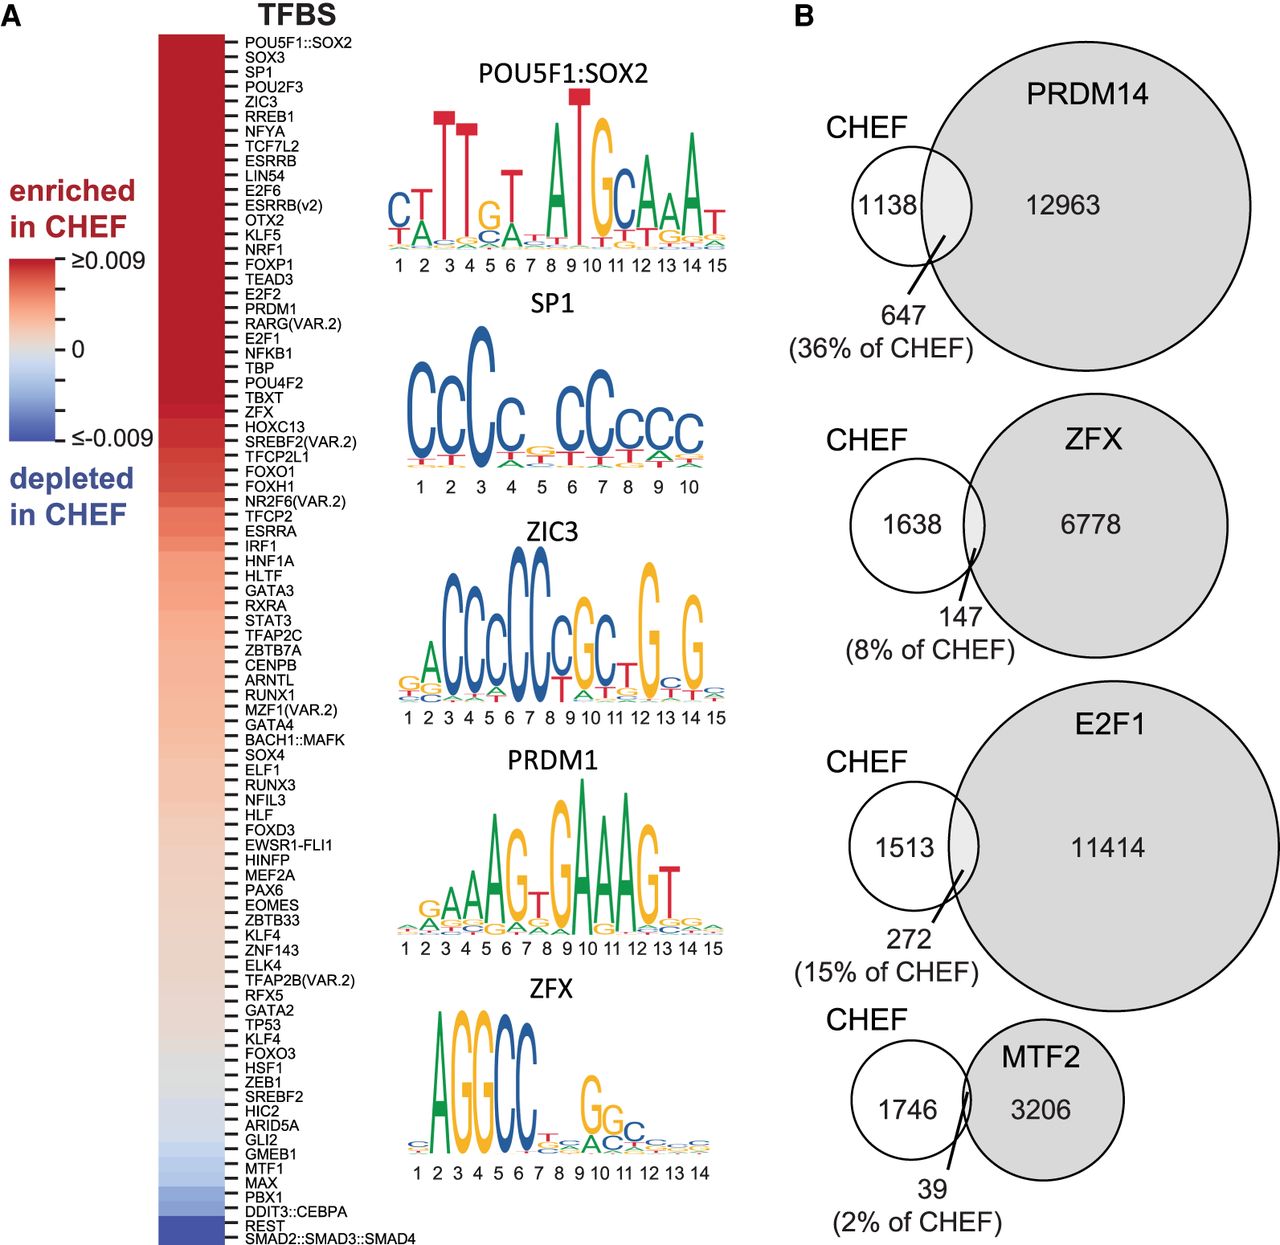
Figure 2.
A large repertoire of transcription factor binding sequences contributes to enhancer activity. (A) Heat map indicating the TFBS sequences enriched (red) or depleted (blue) in conserved high enhancer feature regions (CHEF) compared to the NANOG-bound low enhancer feature regions. (B) Overlap between conserved high enhancer feature (CHEF) regions and ChIP-seq peaks for transcription factors predicted to bind these regions based on TFBS sequence enrichment in CHEF regions (PRDM14, E2F1, ZFX) or predicted not to bind CHEF regions based on TFBS sequence depletion (MTF2).


