
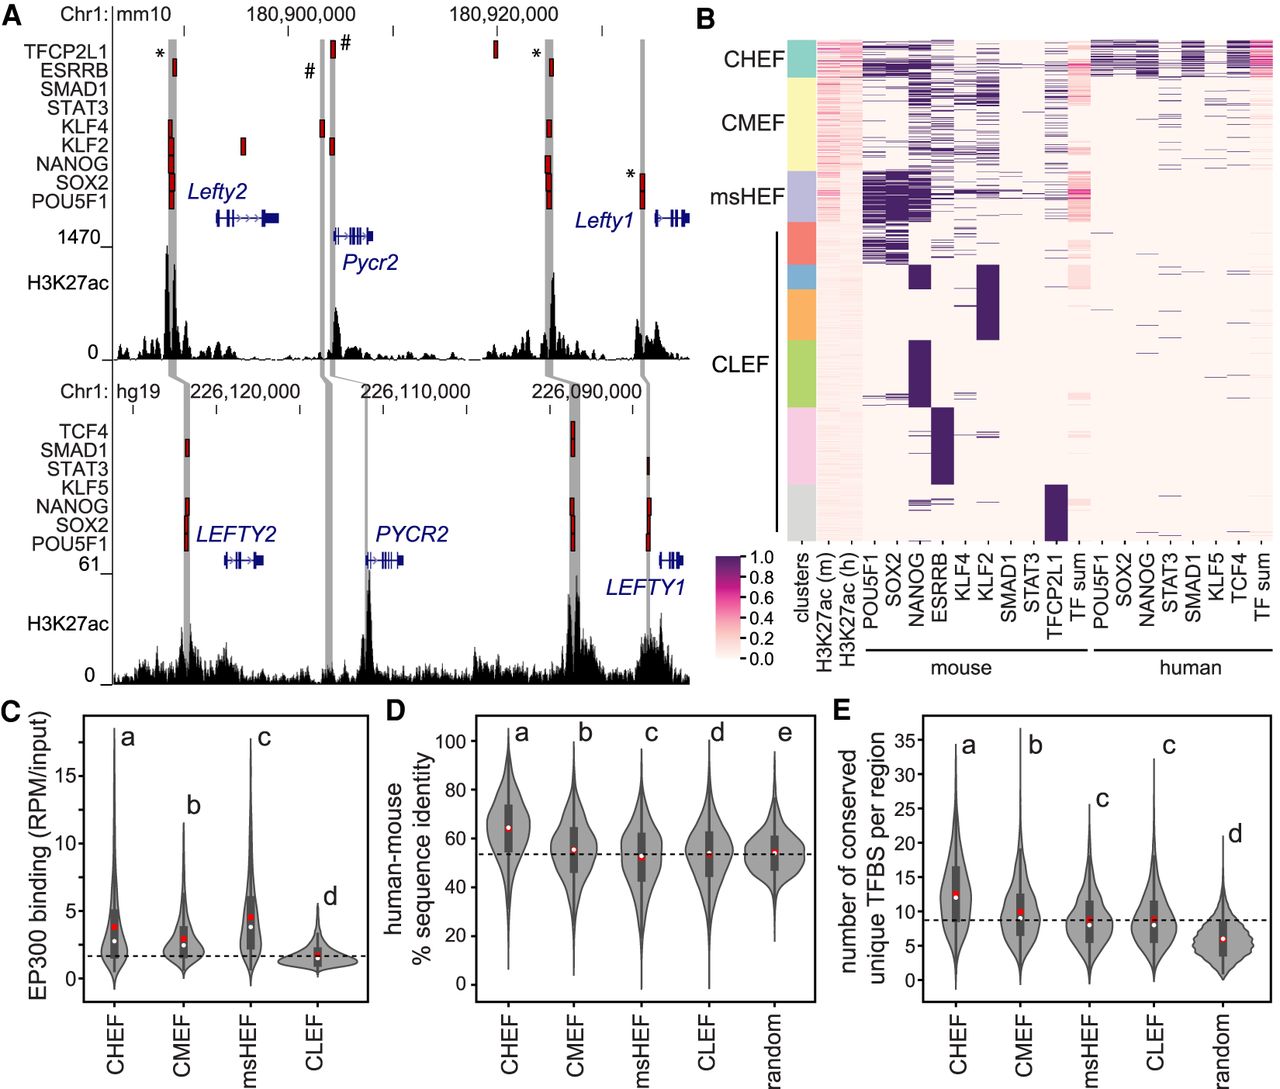
Conserved high enhancer feature (CHEF) regions contain a conserved regulatory code. (A) The Lefty1/Lefty2 locus in the mouse (top) and human (bottom) genomes. Transcription factor–bound regions from ChIP-seq (red bars), mouse and human syntenic regions (gray bars), and H3K27ac ChIP-seq data are displayed on the mm10 and hg19 assemblies of the University of California at Santa Cruz (UCSC) Genome Browser. * indicates regions with conserved binding of multiple transcription factors in mouse and human; # indicates regions with binding only in mouse ESCs. (B) Clustering of transcription factor–bound regions in mouse ESCs, using H3K27ac, transcription factor binding, and the number of transcription factors bound in a region (TF sum) at associated mouse and human regions. (C–E) Groups determined by one-way ANOVA to be significantly different (P < 0.05) are labeled with different letters; to indicate P > 0.05, groups are labeled with the same letter. In the violin plots, the white dot indicates the median; the red box indicates the mean; the dashed line indicates the mean for the CLEF cluster. (C) CHEF, CMEF, and msHEF regions display significantly increased EP300 association compared to CLEF regions. (D) CHEF regions display the highest overall percentage of sequence identity between mouse and human compared to other clusters and random regions not bound by transcription factors. (E) CHEF regions contain an increased number of unique TFBS sequences for ESC-expressed TFs compared to other clusters and random regions not bound by transcription factors. This was identified using MotEvo based on TFBS sequence conservation across six species.


