
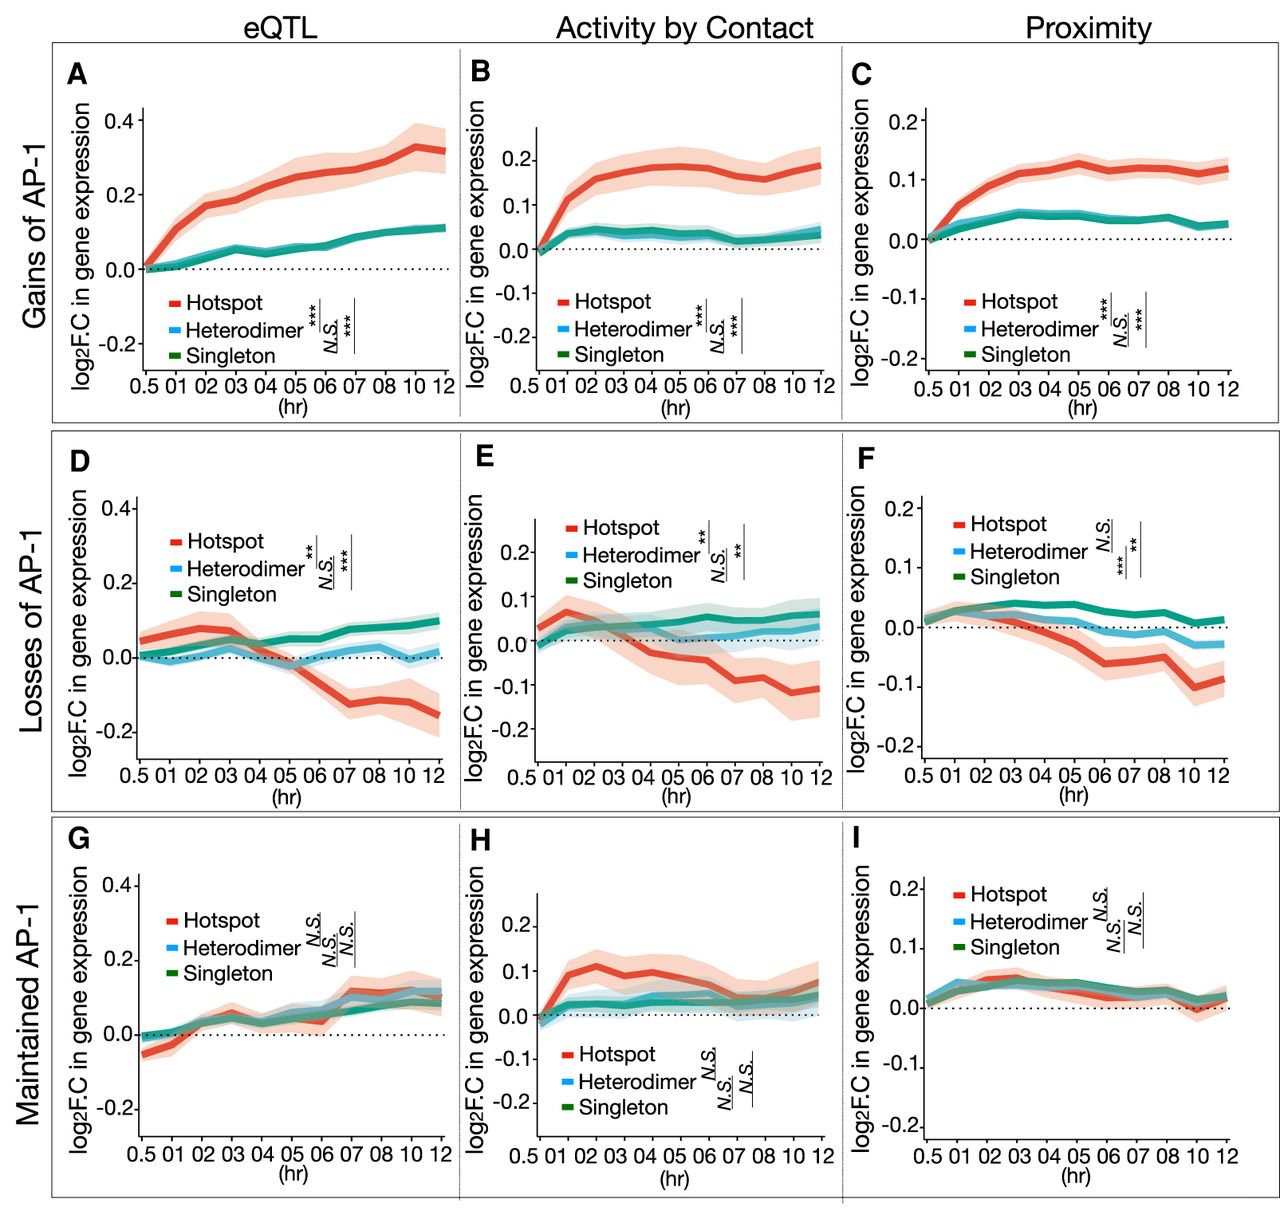
Changes in AP-1 hotspot binding link to changes in gene expression. (A–C) Temporal gene expression trajectory plot showing log2 fold change in gene expression mapped to the gains of each AP-1 binding classes in response to dex according to (A) eQTLs, (B) Activity by Contact defined by Hi-C coupled with chromatin accessibility (DNase-seq) and H3K27ac, and (C) the proximity to the nearest genes. (D–F) Temporal gene expression trajectory plot showing log2 fold change in gene expression mapped to the losses of each AP-1 binding classes in response to dex according to (D) eQTLs, (E) Activity by Contact, and (F) the proximity to the nearest genes. (G–I) Temporal gene expression trajectory plot showing log2 fold change in gene expression mapped to maintained AP-1 binding classes in response to dex according to (G) eQTLs, (H) Activity by Contact, and (I) the proximity to the nearest genes. P-values were calculated using a Wilcoxon rank-sum test based on changes in log2 folds at 12 h. (**) P < 0.01, (***) P < 0.001, N.S. = P > 0.05.


