
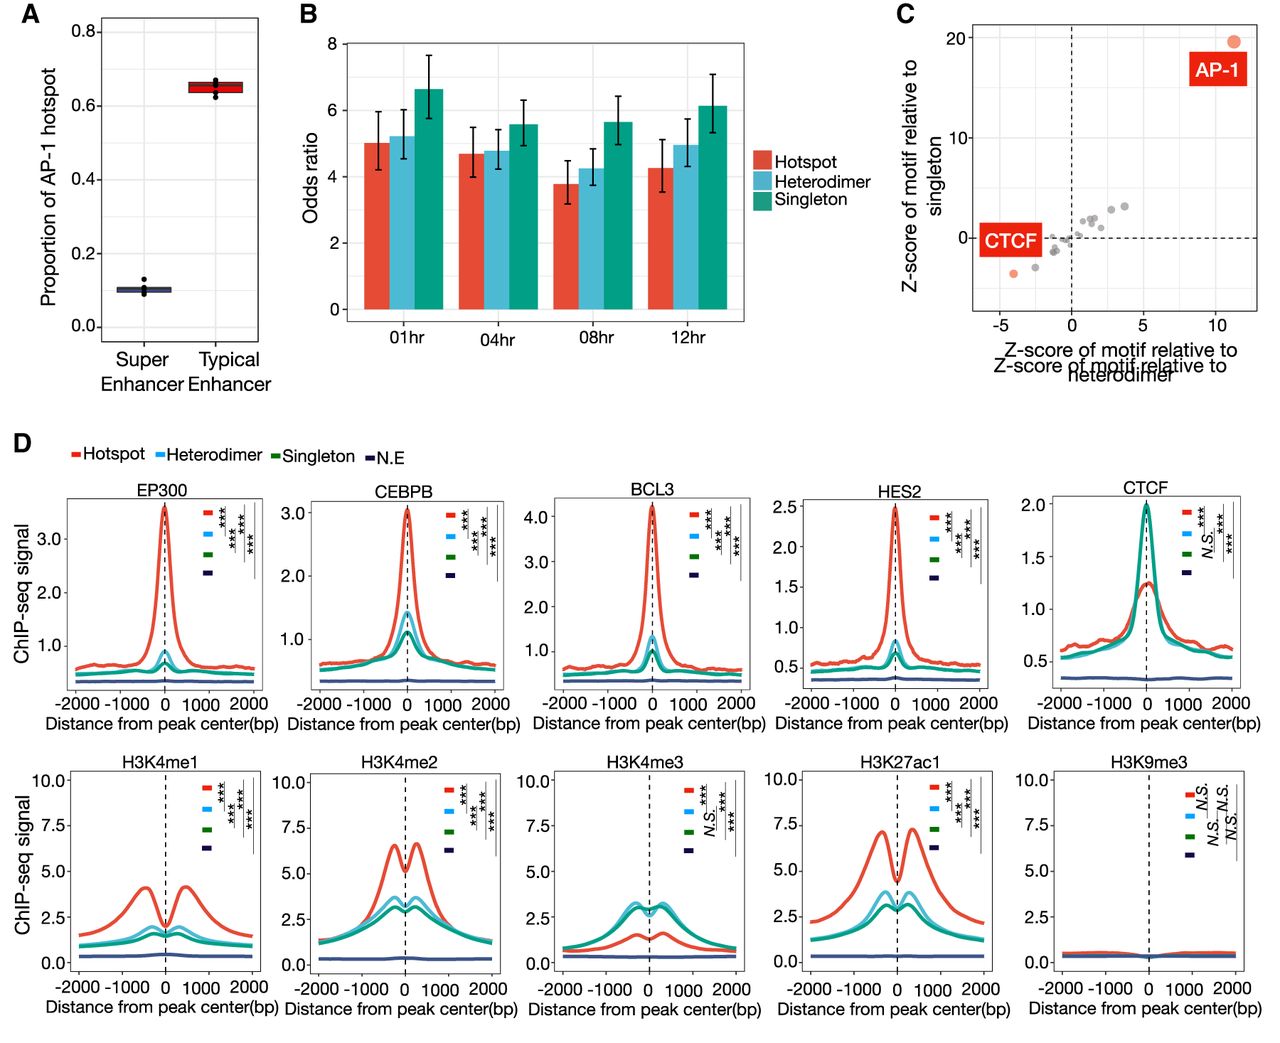
Genomic and chromatin landscape of distinct AP-1 configurations. (A) The distribution of proportion that AP-1 hotspots are localized within super-enhancers and typical enhancers marked by H3K27ac before and after dex treatment. (B) Bar plot showing the odds ratio between super-enhancers and different AP-1 configurations after GR activation. Error bars represent 95% confidence intervals at a given time point. (C) Relative de novo motif enrichment of AP-1 hotspots. Z-scores are based on distribution of significances for given motifs using bootstrapped replicates of other AP-1 binding modes that matched in number for a de novo motif enrichment test. Significant motifs are highlighted. (D) Spatial distribution of TFs and histone marks for distinct AP-1 binding classes. P-values were calculated using a two-sided Student's t-test based on ChIP-seq signal intensity within 1 kb centered on each peak. (***) P < 0.001, N.S. = P > 0.05.


