
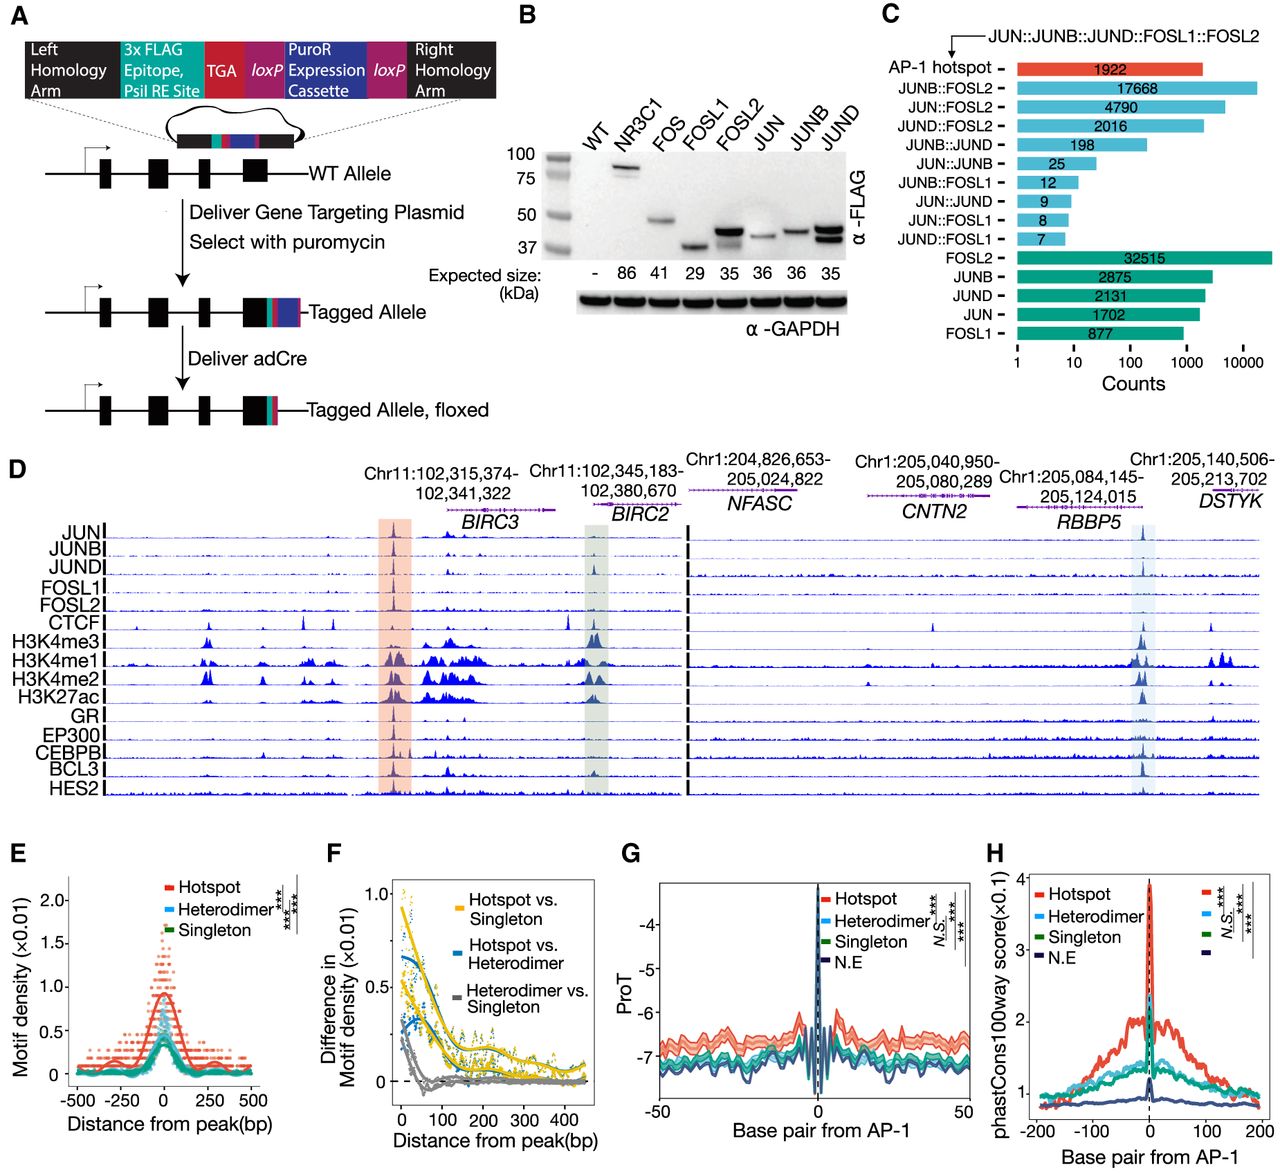
Characterization and dissection of AP-1 subunit occupancy. (A) Schema depicting the genome-engineering strategy. (B) Western blot of engineered cell lines, confirming tagging of the desired gene. (C) Bar plot showing the distribution of AP-1 binding classes across the genome defined by the varying levels of subunit occupancy in response to dexamethasone. (D) Browser tracks of various AP-1 binding configurations. Chromatin signatures and TF occupancy at sites enriched by various AP-1 configurations after GR activations in A549 cells are shown. The identified configurations are depicted by red (AP-1 hotspots), blue (dimer), and green (singleton), respectively. (E) Sitepro plot showing the AP-1 motif per bp per peak for distinct AP-1 binding classes. P-values were calculated using a two-sided Student's t-test based on the normalized motif density within a 1-kb window of peaks. (***) P < 0.001. (F) Sitepro plot showing 95% confidence intervals (C.I.) for the differences in the normalized AP-1 motif density between different AP-1 binding classes across flanking regions of peaks; 95% C.I.’s were calculated using a two-sided Student's t-test based on each of a 7-bp sliding window from the center of the peaks. (G) Sitepro plot showing DNA shape information featured by propeller twist for each AP-1 binding class. P-values were calculated using a two-sided Student's t-test based on quantified DNA shape information within a 100-bp window centered on the motif. (***) P < 0.001, not significant (N.S.) = P > 0.05. (H) Sitepro plot showing GC-matched sequence conservation defined by phastCons100way scores for each AP-1 binding class. P-values were calculated using a two-sided Student's t-test based on the phastCons100way scores within a 400-bp window centered on the motif. (***) P < 0.001, N.S. = P > 0.05.


