
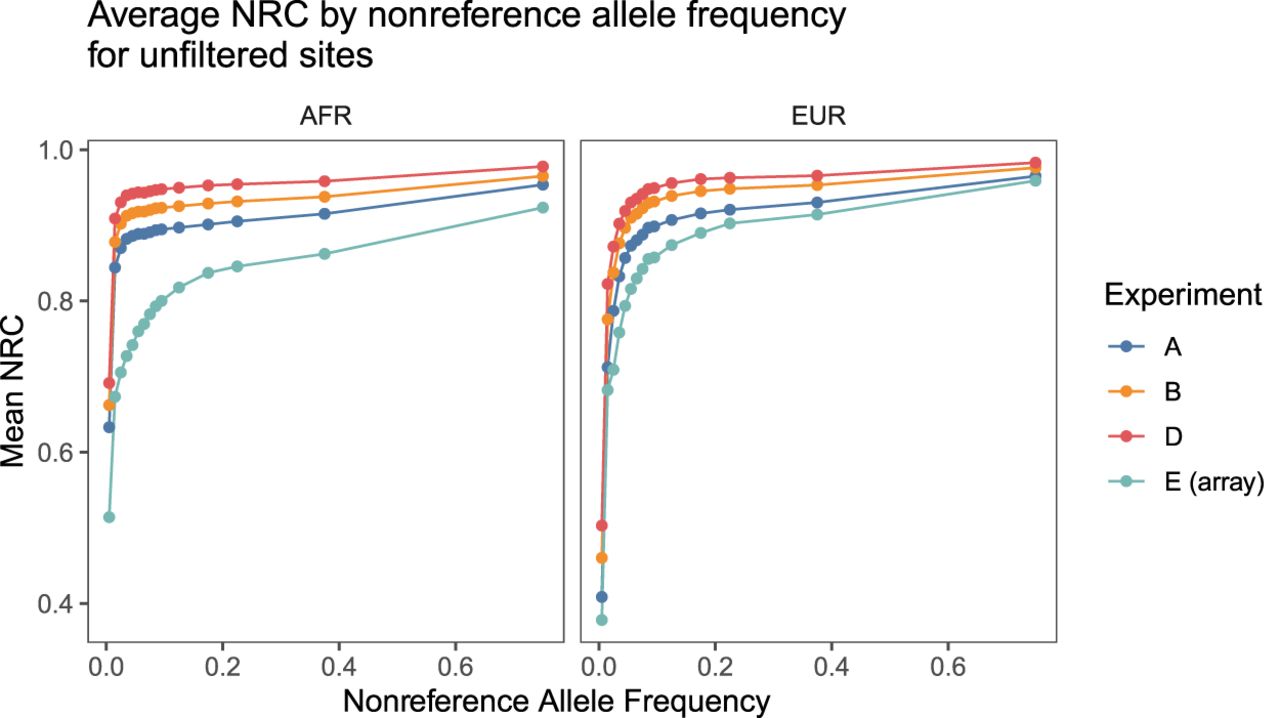
Figure 2.
Average nonreference concordance for unfiltered SNPs by superpopulation by nonreference allele frequency in 1KGP3. The NRC for imputed sequence data was consistently higher than the NRC for the imputed GSA data across the allele frequency spectrum. Filtering to confidently imputed variants reveals a similar pattern (Supplemental Fig. 10).


