
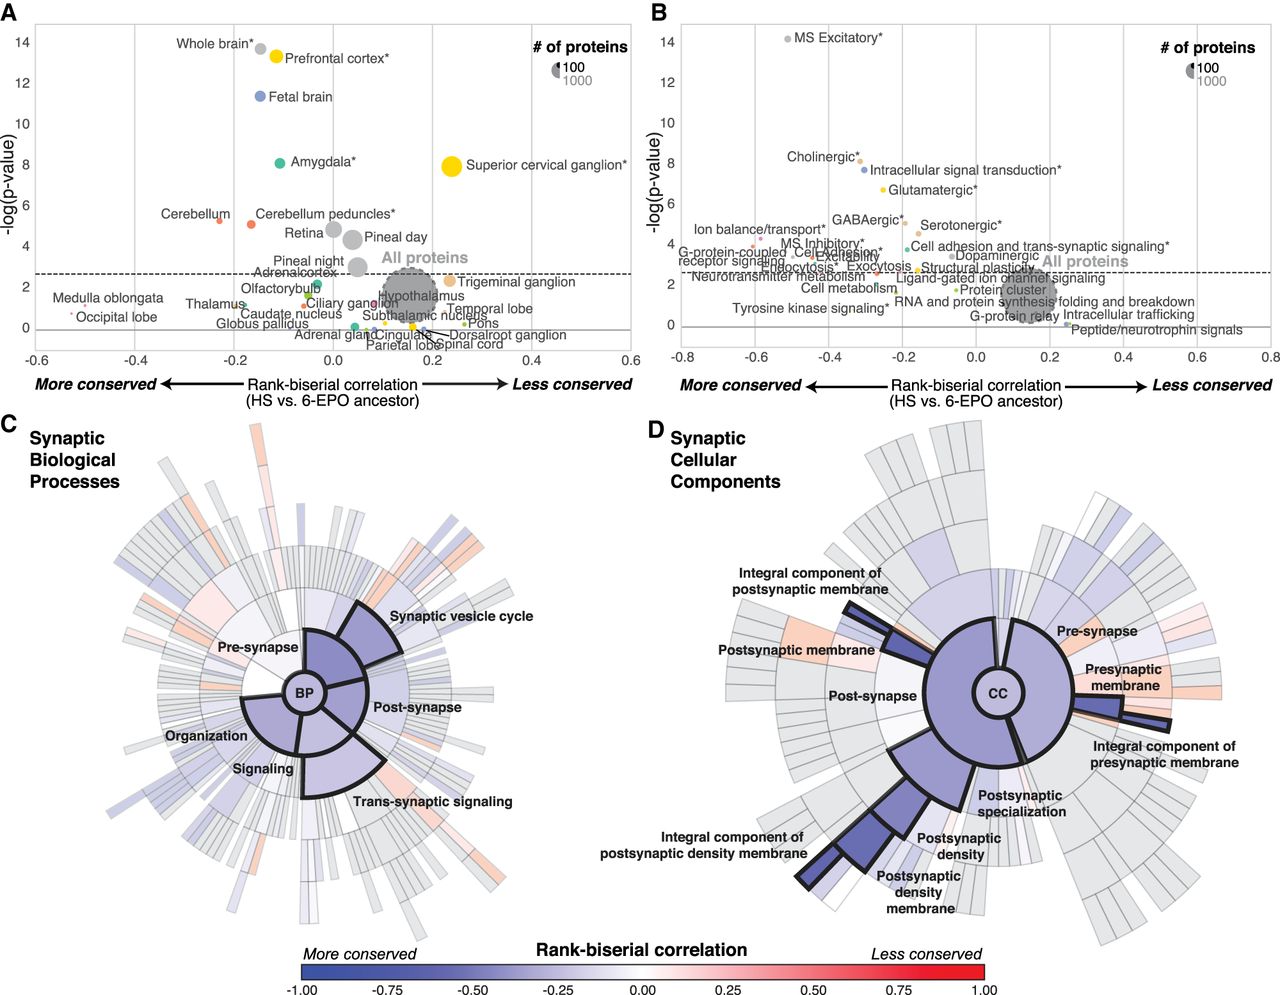
Evolution of brain-related protein-coding genes. (A,B) Funnel plots summarizing the evolution of protein-coding genes specifically expressed in brain substructures (A) and synaptic functions (B); the dashed horizontal line indicates the threshold for significance after Bonferroni correction. Stars indicate sets of genes for which statistical significance was achieved for multiple comparisons with bootstrap correction. (C,D) SynGO sunburst plots showing nested statistically conserved (blue) biological processes (C) and cellular components (D) of the synapse. The circle in the center represents the root node, with the hierarchy moving outward from the center. A segment of the inner circle bears a hierarchical relationship to those segments of the outer circle which lie within the angular sweep of the parent segment.


