
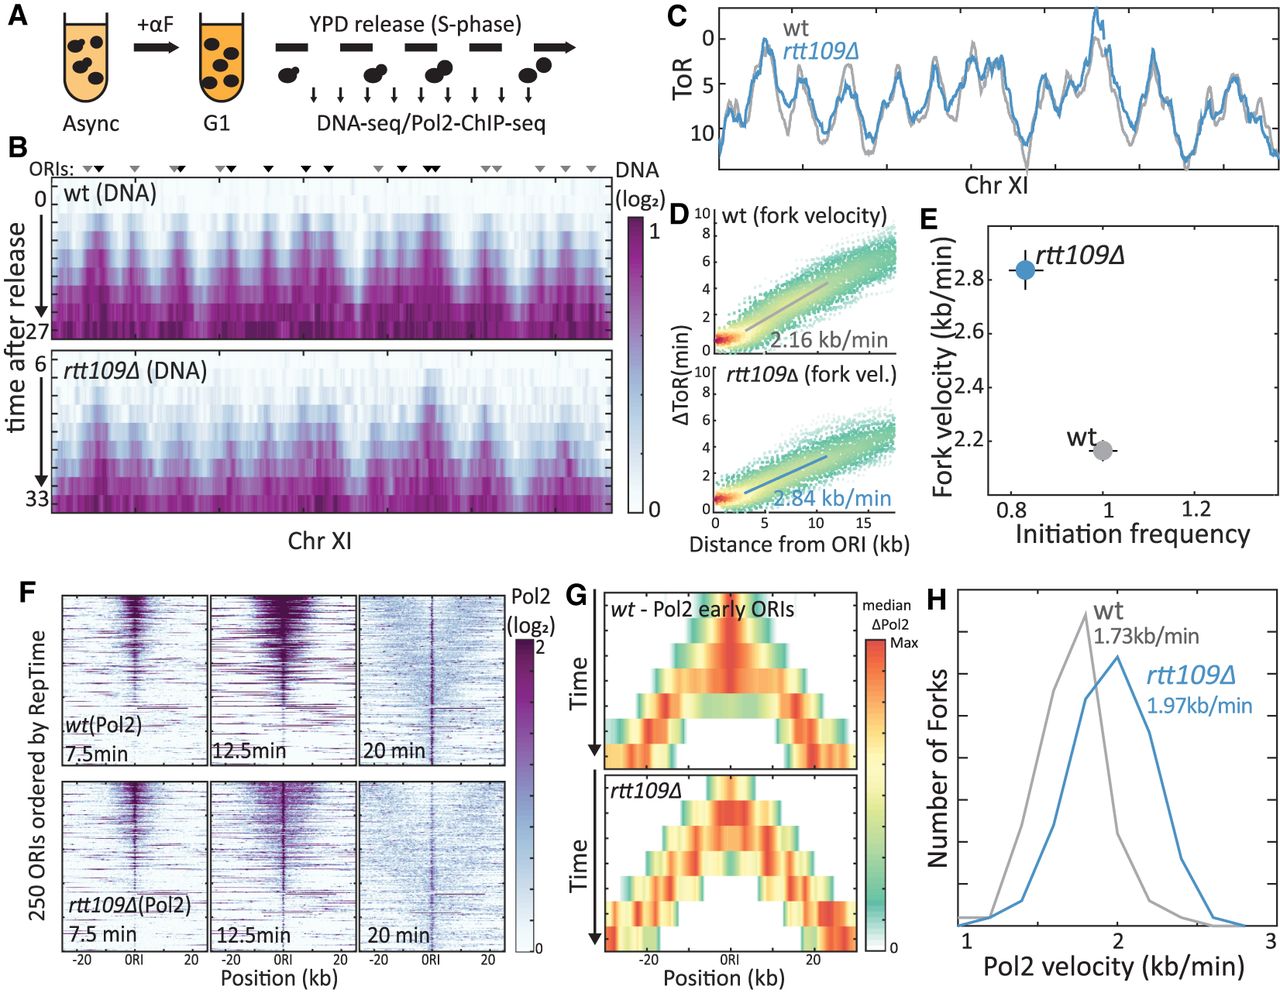
RTT109 deletion increases fork velocity. (A) Experimental scheme. For details, see text. (B) Temporal replication profile measured by DNA content: Shown is the measured DNA content (color-coded) along Chromosome XI at the indicated times for wt (top) and RTT109-deleted (middle) cells. Triangles highlight ORIs (Yabuki et al. 2002), with the color differing between early (black) and late (gray) ORIs. (C) Time of replication (ToR), at each locus, defined as the time when DNA content increased by 40%. For details, see Methods. (D,E) RTT109 deletion accelerates replication: Each point in D represents a locus, replicated by a fork emanating from an early ORI (n = 107 or 91 ORIs for wt and rtt109Δ, respectively). Shown is the locus replication time relative to that of its ORI (ΔToR) as a function of its distance. Solid line is linear regression. Fork velocity calculated from slope is indicated and shown, together with the calculated initiation frequency (Supplemental Fig. S1B) in D (see Methods). (F) Temporal replication measured by Pol2 localization: Shown in F is the Pol2 abundance (color-coded) around 250 active ORIs at the indicated times. ORIs are ordered by their reported replication time (RepTime) (Yabuki et al. 2002): wt profiles on top, rtt109Δ profiles on the bottom. (G,H) RTT109 deletion increases fork velocity: Shown is the median Pol2 occupancy around early ORIs at the indicated times in wt (top) and RTT109-deleted (bottom) cells. The distribution of Pol2 velocity, as calculated from the temporal spread around each ORI is shown in G. n > 100 ORIs in two ChIP experiments that were analyzed per strain; median values are indicated (see Methods).


