
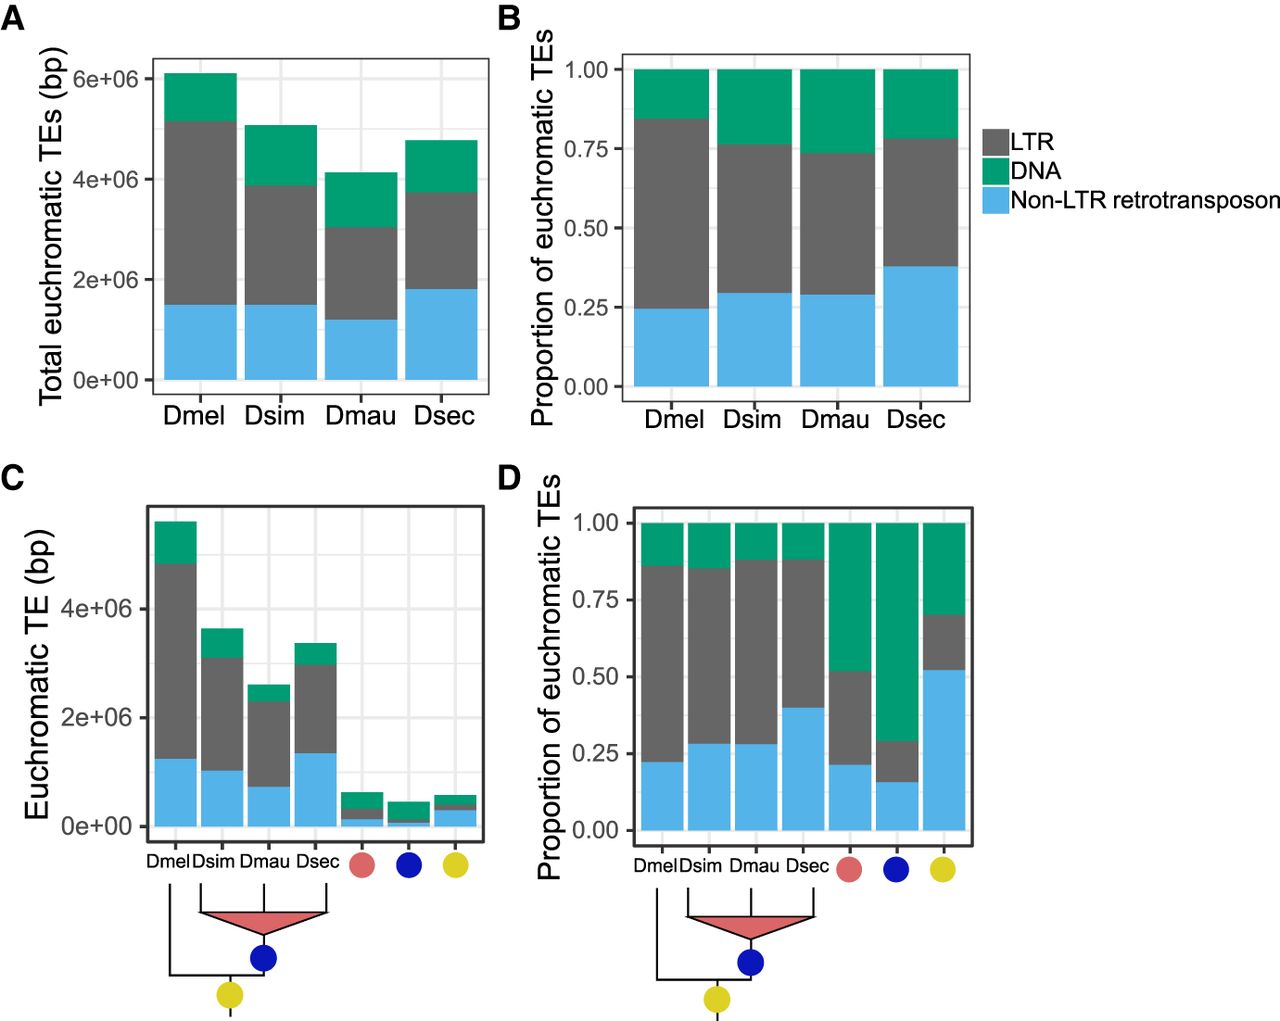
Euchromatic transposon sequence content in each species and their ancestral lineages in the mel-complex. The bars represent the absolute content (A,C) or relative proportion within each category (B,D) of TE bases owing to DNA and to LTR and non-LTR retrotransposon TEs. A and B show total TE content in each species. Panels C and D show the TE content confined to specific lineages. In panels C and D, the species names indicate TE sequence found only in that genome; the red circles indicate TE content found in two sim-complex species; the blue circles indicate TEs found in the sim-complex but not D. melanogaster; and the yellow circles indicate TE sequence found in all four mel-complex species.


