
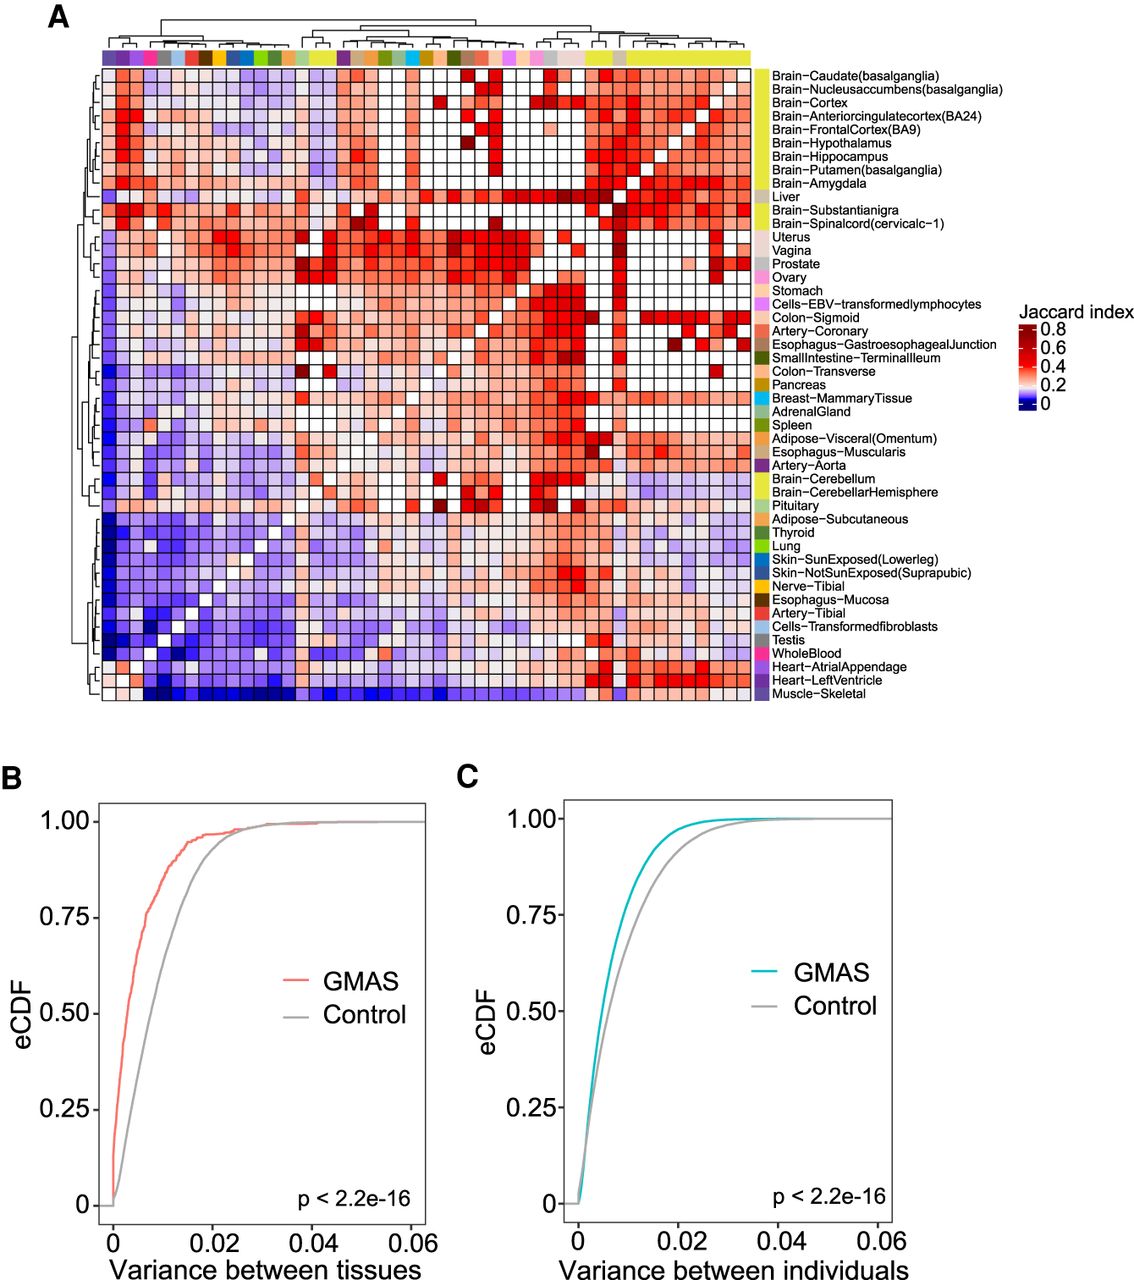
Figure 2.
Comparison of GMAS patterns across tissues or individuals. (A) Heat map of the Jaccard indices of GMAS exons between each pair of tissues (Methods). White boxes correspond to tissue pairs with <10 common testable exons. (B) Empirical cumulative distribution function (eCDF) of variances across tissues in the allelic biases of tag SNPs of GMAS exons for all individuals. Controls were included for comparison purposes (Methods). The P-value was calculated using the Kolmogorov–Smirnov test. (C) Similar to B but for variance across individuals per tissue.


