
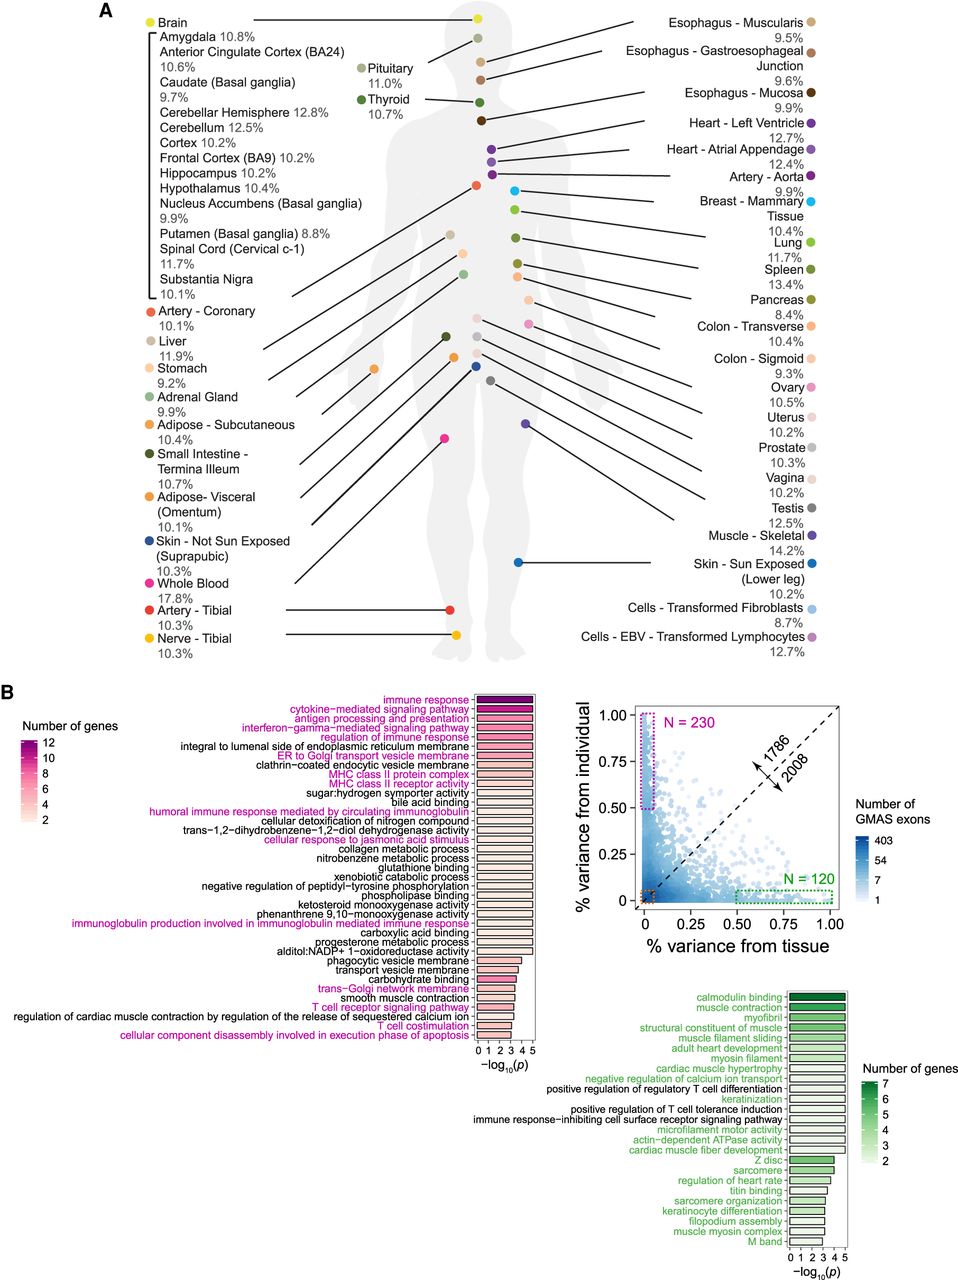
The landscape of GMAS exons in human tissues. (A) % of GMAS exons among all testable exons in each tissue (averaged across individuals). (B) The variability of GMAS patterns across tissues and individuals (Methods). Each dot represents an exon, and the colors represent the number of overlapping dots. This analysis only included GMAS exons that exist in ≥2 individuals per tissue and ≥2 tissues per individual. The numbers along the diagonal line show the number of GMAS exons above and below the line, respectively. GO terms enriched among genes in the high variability groups (boxed) are shown. Color intensity represents the number of genes associated with each significant GO term. The P-values were estimated based on 10,000 randomizations of control genes (i.e., genes hosting alternatively spliced exons that were tested for GMAS) matching gene length and GC content of the test genes (Hsiao et al. 2016a). The significant cutoff of the P-value was set to be 1/(number of total GO terms considered).


