
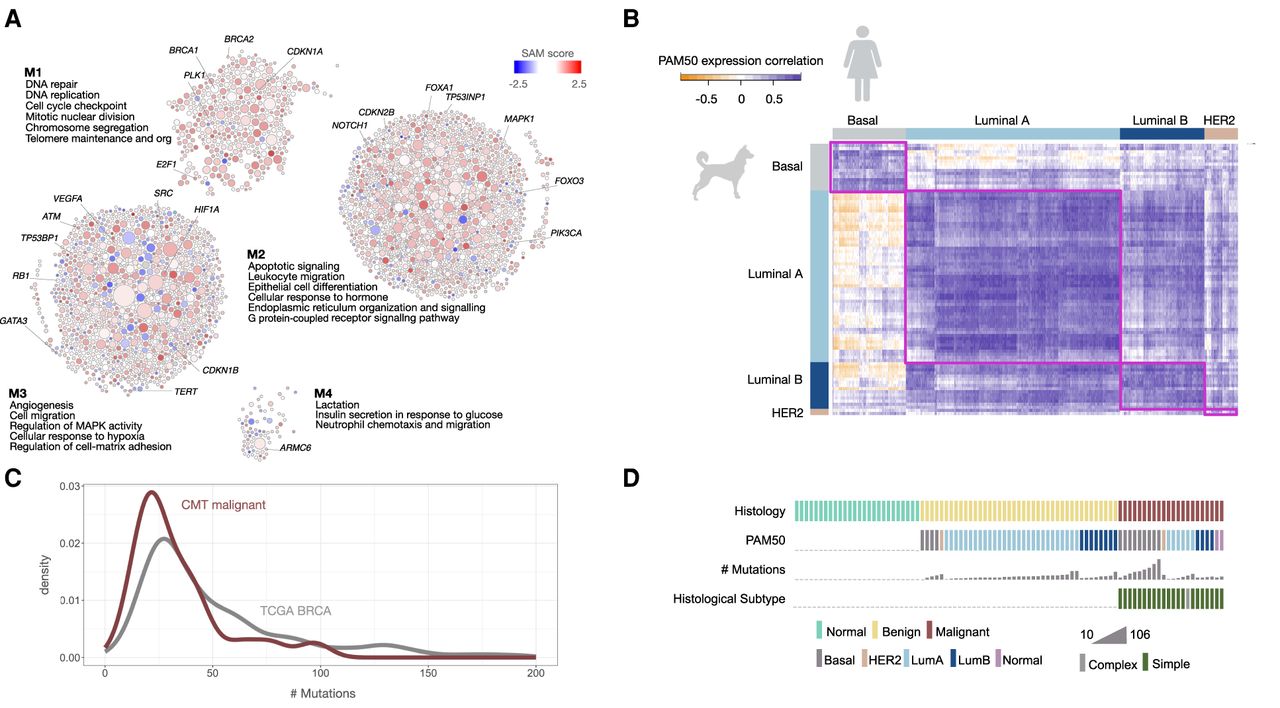
Cancer hallmark processes found in CMT transcriptional programs. (A) Biological processes showing differential gene expression between normal and carcinoma samples (Supplemental Table S2) were identified by network-based enrichment method at https://humanbase.flatironinstitute.org. Differentially expressed genes were clustered using a shared nearest neighbor–based community-finding algorithm to identify distinct modules of tightly connected genes (Krishnan et al. 2016) within the mammary epithelium functional network (Greene et al. 2015). Gene Ontology (GO) enrichment was performed on each module, and representative significant processes are displayed (for the entire list, see Supplemental Table S3). Circles are genes and the size of the circle indicates the sum of connections in the graph. Gene expression values (SAM scores) are overlaid. Red indicates increased expression in carcinoma, and blue indicates decreased expression in carcinoma. COSMIC cancer census genes are indicated in each module (M1–M4). (B) Human PAM50 intrinsic subtype signals are found in CMTs. Each bar represents the number of samples predicted for each PAM50 subtype, human or canine. Predictions for CMT samples were based on gene expression programs using a classifier trained on human BRCA samples and PAM50 subtype gene expression signature data. In human samples, 98% were correctly predicted, reflecting the accuracy of the predictor. (C) Density plot showing the genome-wide number of mutations per tumor sample in human (gray) and canine (maroon). (D) OncoPrint showing histology, predicted PAM50 subtype, number of mutations, and histologic subtype (simple/complex) for each sample in the cohort.


