
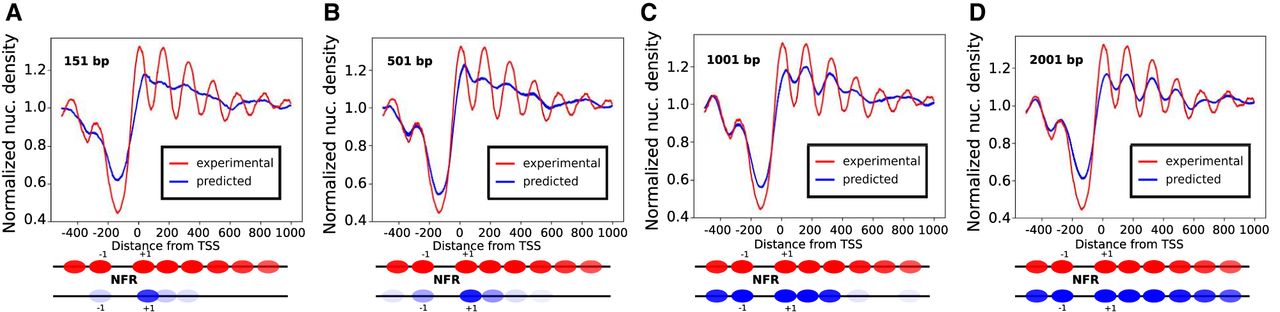
Figure 2.
Influence of the input length L on the pattern of the predicted nucleosome density in TSS regions. Average predicted (blue) and experimental (red) nucleosome density in TSS regions. The predicted nucleosome density is here obtained with CNN models trained with different values of L ([A]: 151 bp, [B]: 501 bp, [C]: 1001 bp, [D]: 2001 bp). The other hyperparameters of the network are the same. Nucleosome positions (in red for the experimental and blue for the predicted densities) are sketched below the curves. +1 and −1 refer to the first nucleosomes before and after the NDR.


