
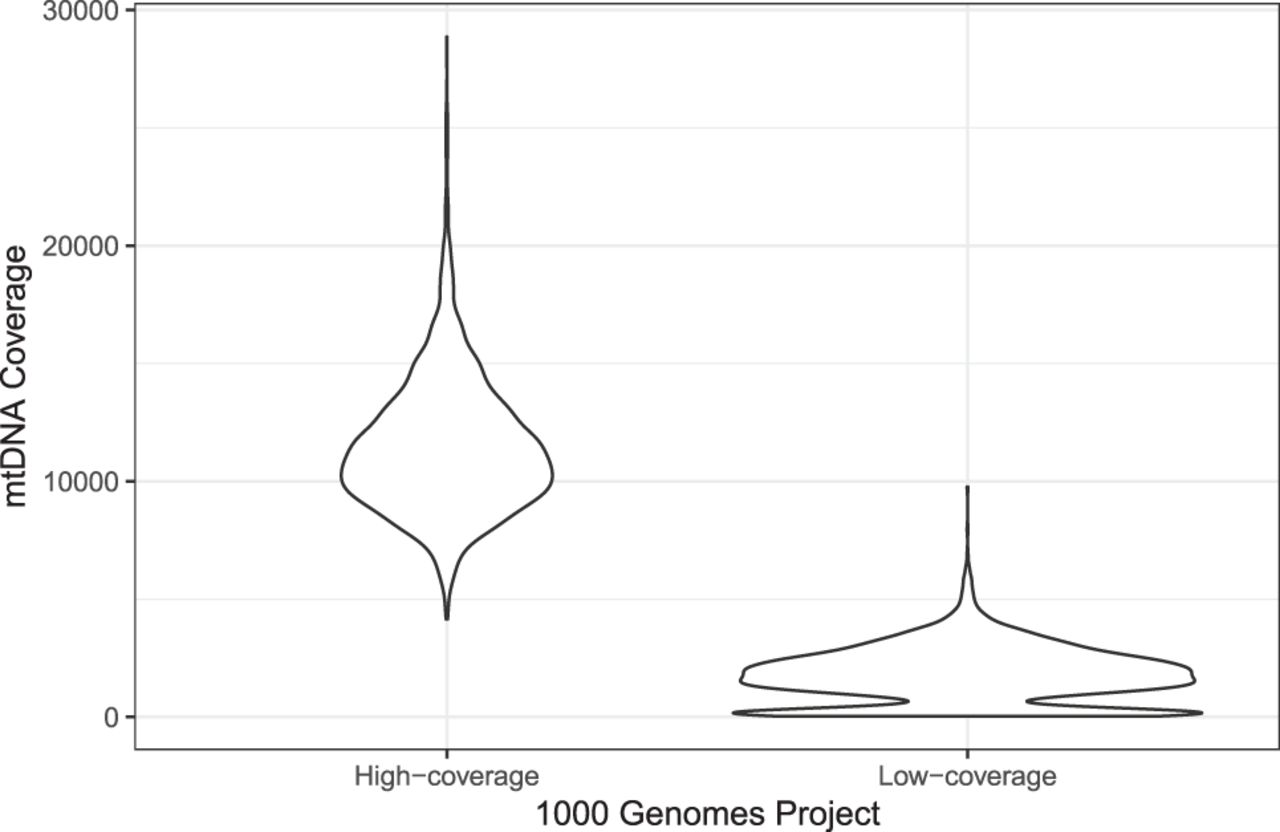
Figure 2.
Violin plot representing the mean coverage over all 2504 samples in the two The 1000 Genomes Project Consortium data sets (high-coverage and low-Coverage). Because of different tissues in the low-coverage data, different clusters of coverage can be observed, resulting in wrong mtDNA contamination estimates for nDNA. It can be seen that the second peak within the low-coverage group vanishes for the high-coverage data, resulting in better estimates for extrapolation.


