
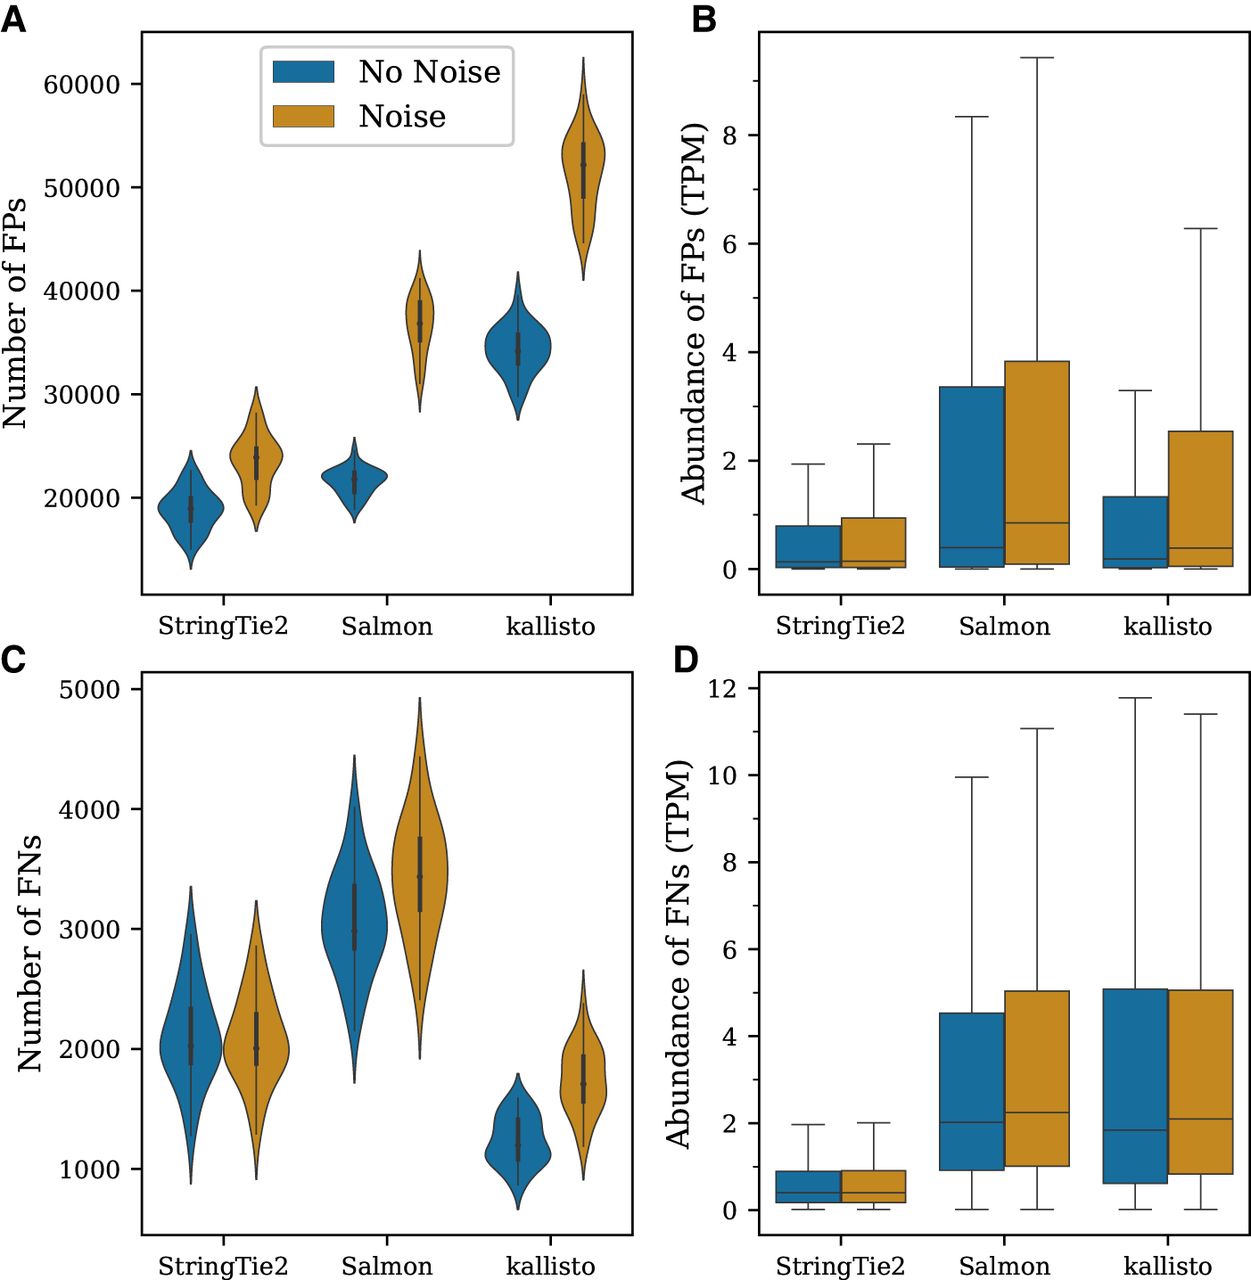
Figure 2.
Effects of transcriptional noise on the transcript-level abundance estimation quantified across the 30 samples in the simulated data set. (A) Distribution of the number of false-positive (FP) observations per sample, with (brown) and without (blue) noise. (B) Expression levels assigned to FPs in the absence and presence of noise. (C) Distribution of the number of false-negative (FN) observations per sample. (D) Expression levels of FNs in the absence and presence of noise.


