
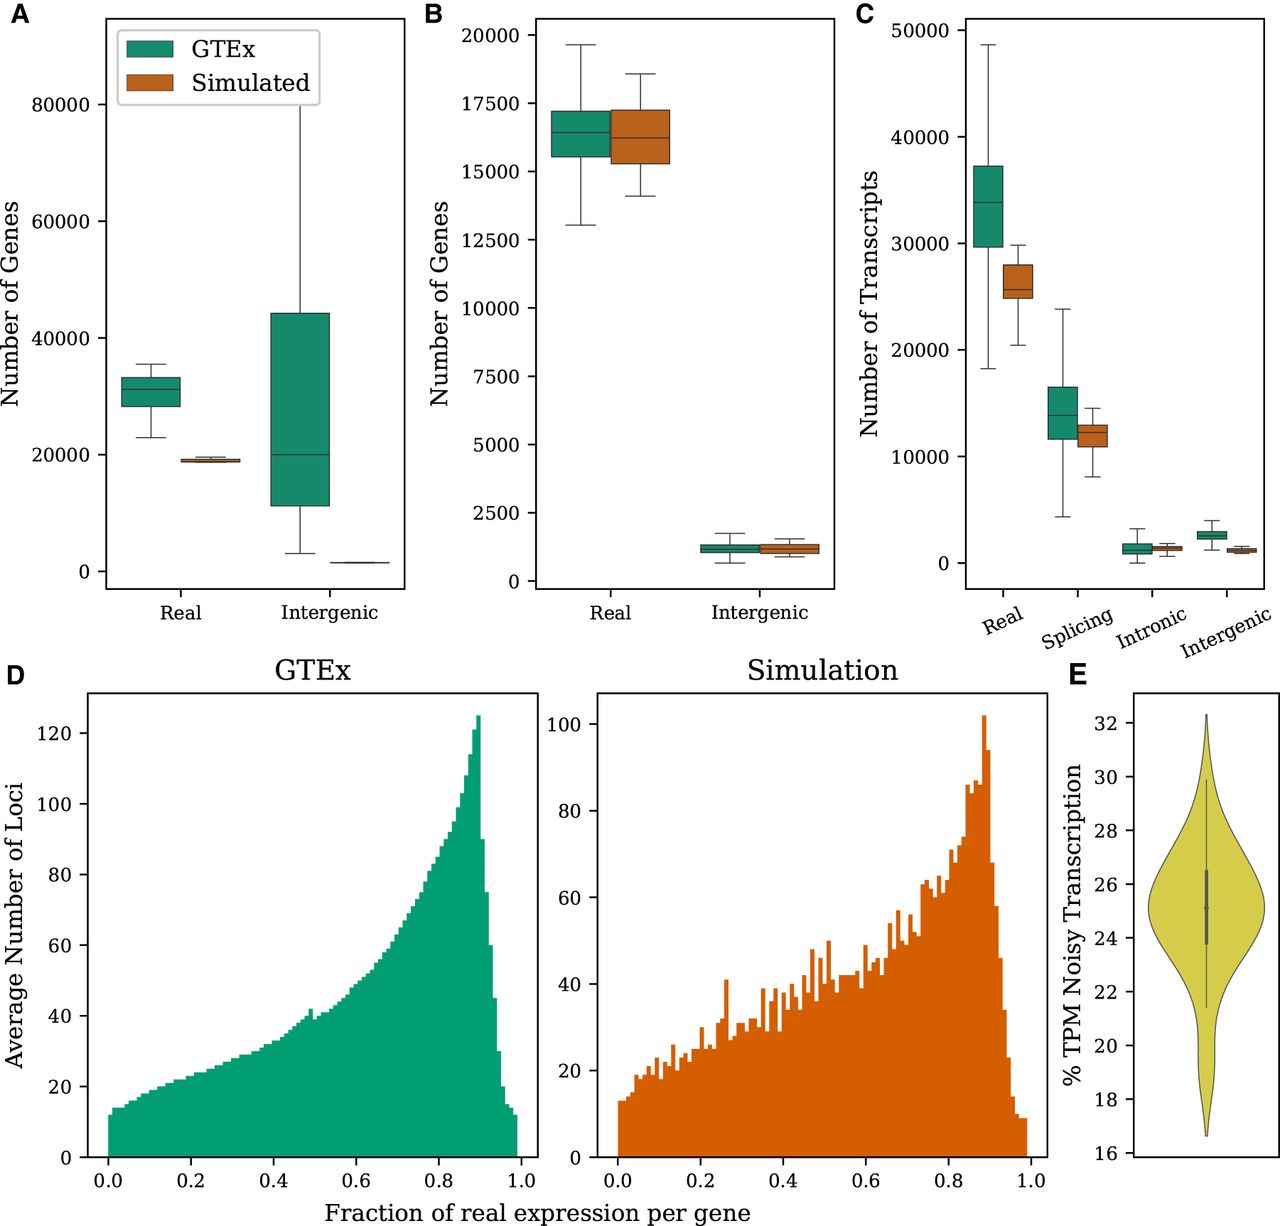
Figure 1.
Properties of the GTEx data set computed from transcriptome assemblies built for the CHESS database (Pertea et al. 2018) compared with simulated data. (A) Distributions of the number of annotated and intergenic loci observed per tissue. (B) Distributions of the number of annotated and intergenic loci observed per sample. (C) Distributions of the number of transcripts representing each noise type in a sample. (D) Fraction of expression in a typical sample that comes from real isoforms versus noisy isoforms. Only loci having both annotated and noisy transcripts being expressed are included. (E) Fraction of total expression from noisy transcripts in simulated samples.


