
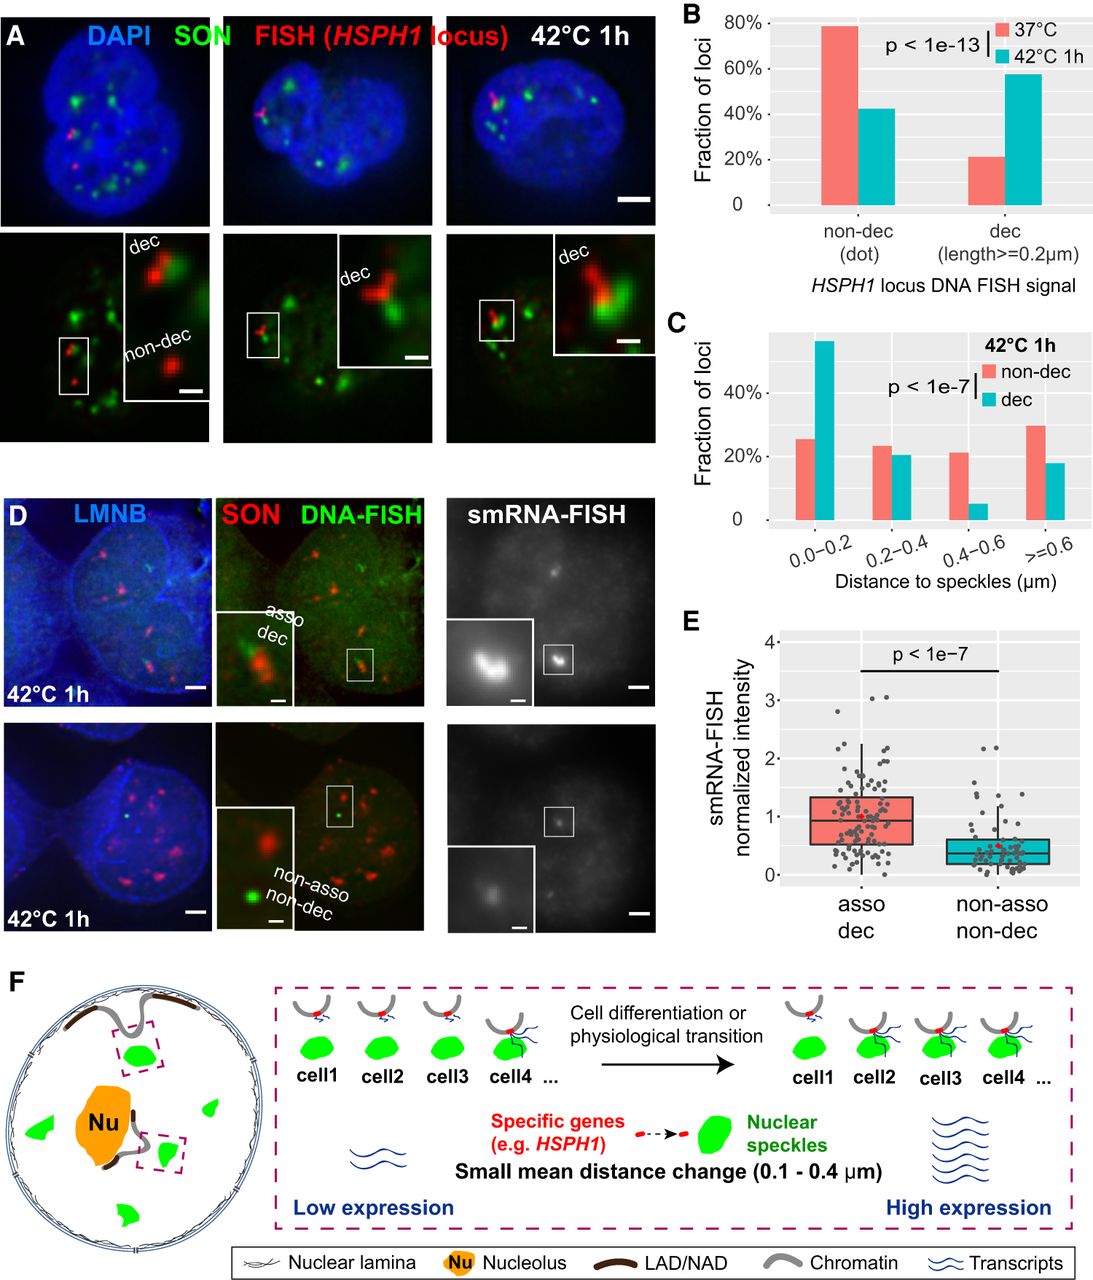
Both distance shift toward speckles and large-scale chromatin decondensation of HSPH1 locus after heat shock correlate with gene expression amplification in K562 cells. (A) 3D immuno-FISH for HSPH1 locus (red) plus SON immunostaining (green) and merged channels with DAPI (blue, top; scale bar: 2 μm) in K562 cells after heat shock (42°C 1 h). Types of FISH signals: left: decondensed (upper, elongated) and non-decondensed signals (lower, dot); middle and right: decondensed signals. Insets: 3× enlargement of region in white box (bottom, scale bars: 0.5 μm). (B) Increase in decondensed HSPH1 loci fraction after heat shock: n = 198 (37°C) or 224 (42°C 1 h), combination of two biological replicates; χ2 test of homogeneity, P = 3.045 × 10⁻¹⁴. (C) Speckle distance distributions for different cases of HSPH1 locus FISH signals in K562 cells after 1 h heat shock (42°C): n = 141 (non-decondensed, dot) or 200 (decondensed, ≥0.2 μm in length), combination of two biological replicates; χ2 test of homogeneity, P = 2.74 × 10⁻⁸ between non-decondensed and decondensed. (D) Combined DNA- and single-molecule RNA (smRNA)-immuno-FISH for HSPH1 locus showing DNA-FISH signal (green), SON immunostaining (red), Lamin B1/B2 (LMNB) immunostaining signal (blue), and smRNA-FISH (gray) in K562 cells after 1 h heat shock (scale bars: 2 μm). Decondensed chromatin structure (elongated DNA-FISH signal) with speckle association (top) and non-decondensed (dot DNA-FISH signal) not associated with speckles (bottom) and their corresponding smRNA-FISH signal (right). Insets: 3× enlargement of white-boxed area (scale bar: 0.5 μm). Single optical section is shown containing center (in z) of DNA FISH signal; RNA-FISH images correspond to projected sum of 20 optical sections. (E) Normalized smRNA-FISH signals corresponding to different chromatin states based on DNA immuno-FISH. Combination of two biological replicates: asso dec: distance to speckles <0.4 µm and signal length ≥0.4 µm, n = 108, mean = 1.00, median = 0.93; non-asso non-dec: distance ≥0.6 µm and dot signal, n = 68, mean = 0.50, median = 0.37. Box plots (data points: gray dots, means: red dots) show median (inside line), 25th (box bottom) and 75th (box top) percentiles, 75th percentile to highest value within 1.5-fold of box height (top whisker), 25th percentile to lowest value within 1.5-fold of box height (bottom whisker). Welch's t-test: P = 1.179 × 10⁻⁸. (F) Cartoon model: small mean distance changes relative to nuclear speckles predicted by TSA-seq may reflect changes in the distribution of distances such that an increased fraction of alleles shows close association with nuclear speckles with an accompanying amplification of gene expression.


