
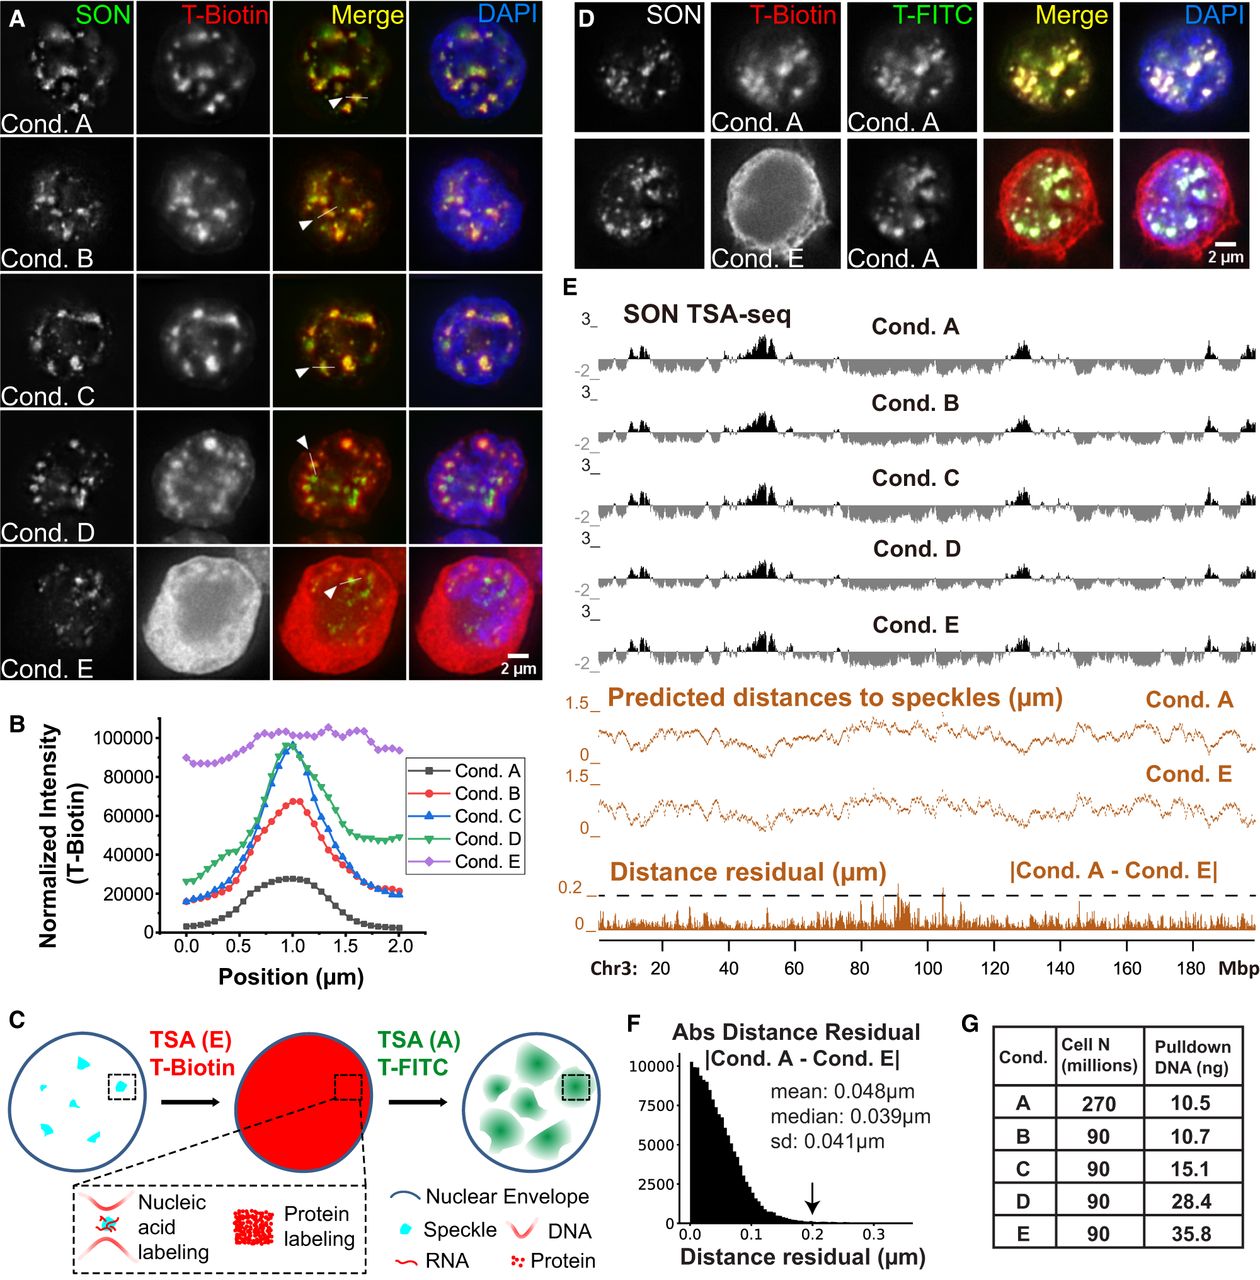
TSA-seq 2.0 enables 10- to 20-fold increase in sensitivity but preserves distance mapping capability. (A) TSA Conditions A–E (K562 cells) show varying nuclear speckle specificity. SON immunostaining of speckles (green), streptavidin tyramide-biotin staining (red), merged channels, plus DNA (DAPI, blue). (B) Tyramide-biotin intensities along line profiles spanning nuclear speckles in A for Conditions A–E. (C) Schema predicting results from following Condition E tyramide-biotin TSA staining with Condition A tyramide-FITC TSA staining, assuming Condition E saturates protein but not DNA tyramide-labeling. (D) Experimental results for schema in C. Top row: Control showing two consecutive rounds of Condition A (nonsaturating) TSA-labeling using tyramide-biotin and then tyramide-FITC. Bottom row: Same as top row but using Condition E for first TSA-labeling. SON immunostaining (gray), tyramide-biotin (red), tyramide-FITC (green), merged channels, plus DAPI (blue). (E) SON TSA-seq mapping results for Conditions A–E showing TSA-seq enrichment scores (black tracks), estimated speckle distances (Conditions A and E, middle orange tracks), and residuals (absolute magnitude) between Conditions A and E distances (bottom, orange track). (F) Histogram of distance residuals in E: number (y-axis), residual value (x-axis). (G) Cell numbers used and pulldown DNA yields for TSA Conditions A–E.


