
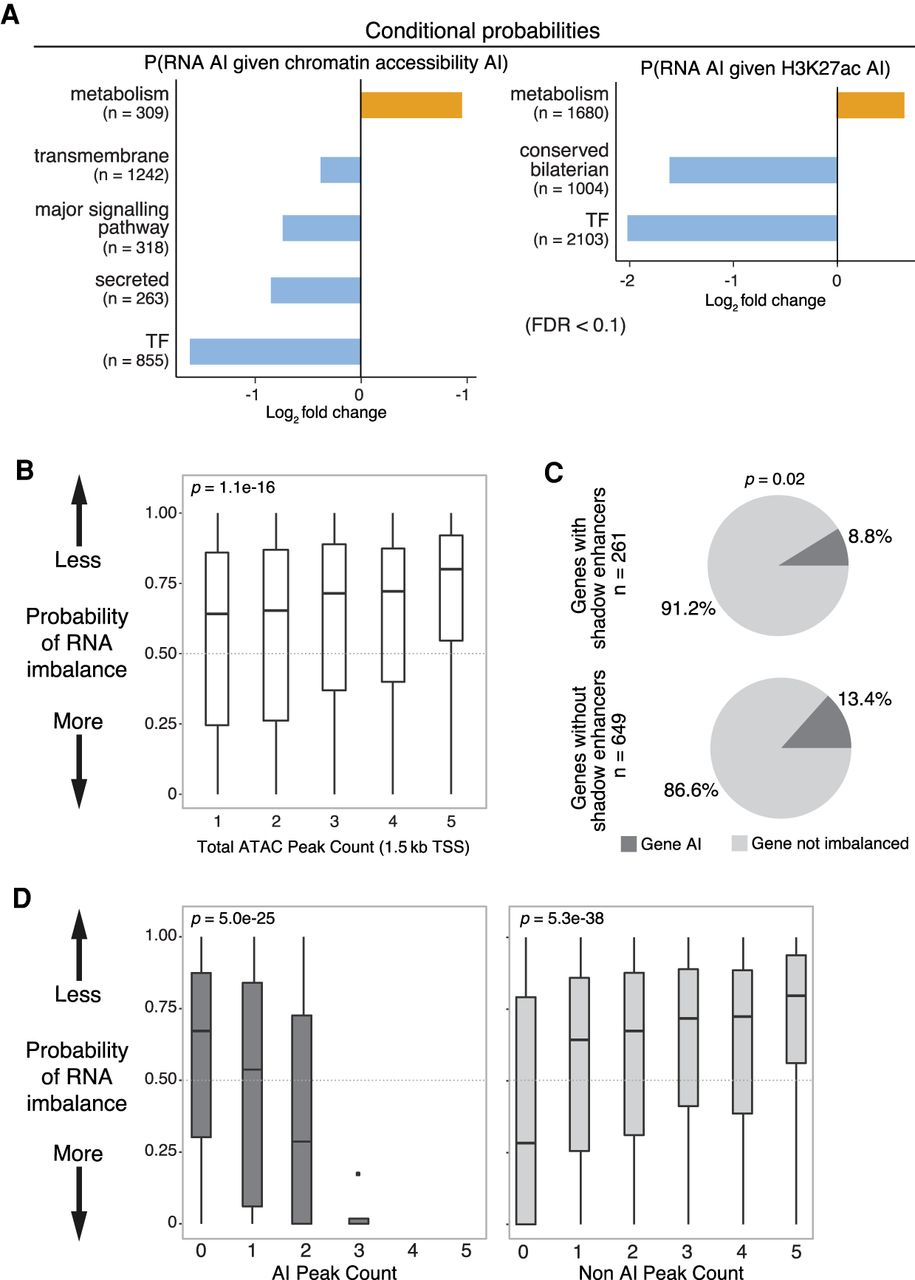
Regulatory buffering varies across gene categories and with local chromatin structure. (A) Conditional probability of AI in gene expression given AI in associated chromatin (left) and H3K27ac (right) peaks across gene categories. X-axis shows log2 fold change; background is genome-wide expectation. Gene categories enriched (orange) or depleted (blue) for imbalance are indicated (FDR > 0.1, Fisher's exact test). n = number of genes per category combined across all lines and both 6- to 8-h and 10- to 12-h samples. (B) Box plots show probabilities of AI in gene expression based on numbers of neighboring ATAC peaks (TSS < 1.5 kb). Genes with more ATAC peaks are less likely to show AI. (C) Pie charts show the proportion of genes with AI in RNA associated to ATAC-seq peaks overlapping known partially redundant/shadow enhancers (top) or not (bottom). Genes associated with shadow enhancers are less likely to have AI (determined using a beta-binomial model; x2=5.3, P = 0.02). (D) Box plots show the probability of AI in gene expression (P-value from a beta-binomial model; y-axis) as a function of the number of ATAC-seq peaks with AI (left) or not imbalanced (right).


