
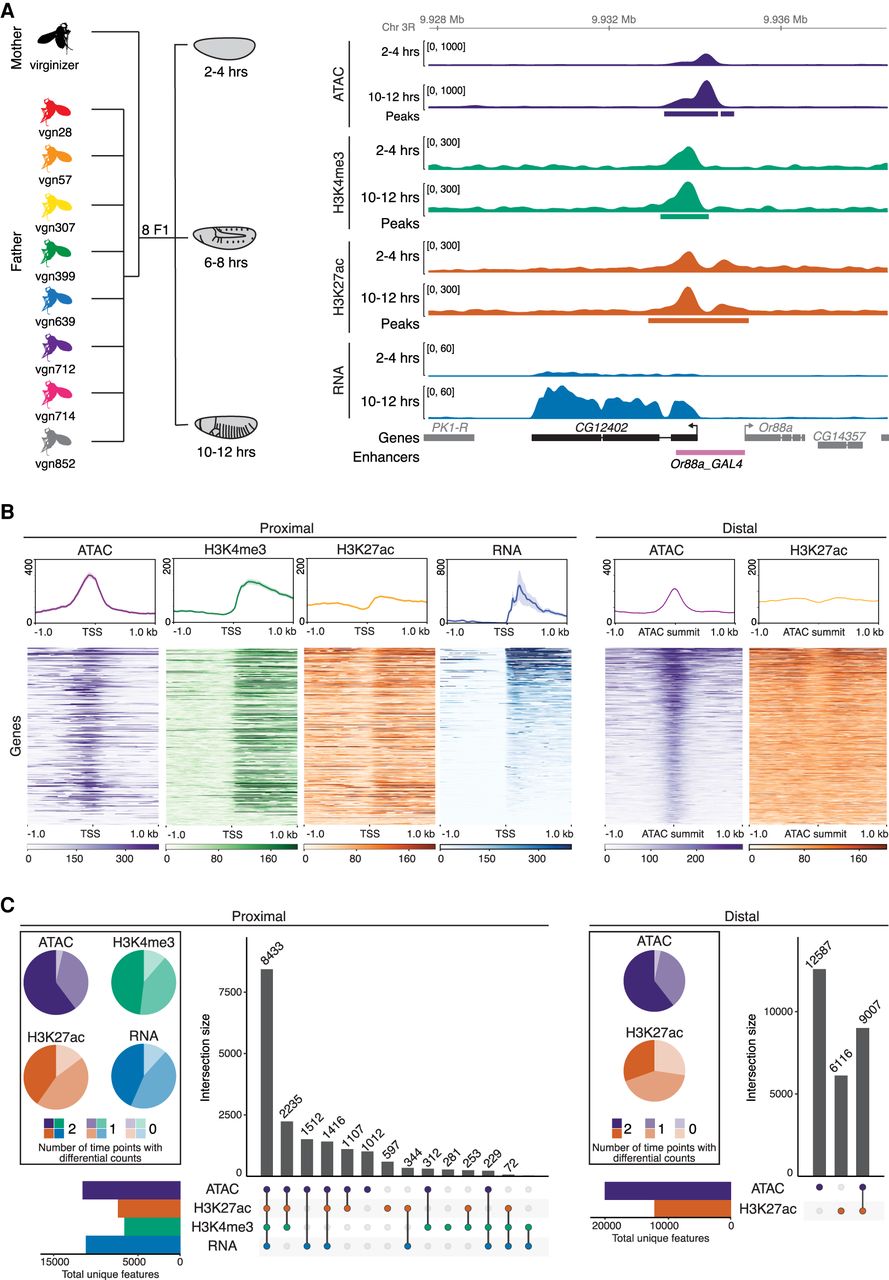
Quantifying gene expression and regulatory element activity in F1 embryos. (A, left) Experimental design and data structure. RNA-seq, ATAC-seq, and iChIP of H3K4me3 and H3K27ac were performed on embryos at three developmental stages from eight F1 hybrids with a common maternal line. (Right) Genome browser overview for the CG12402 locus showing all data for 2–4 h and 10–12 h for the genotype vgn28. Bottom track shows curated enhancers (Kvon et al. 2014). (B, top) Density plots for representative cross (vgn × DGRP-639) at 6–8 h showing read count signal for TSS proximal and distal regions. Plots centered at TSS for promoter-proximal (left) and ATAC summits for distal (right) regions; shaded regions indicate 95% confidence intervals. (Bottom) Heatmaps showing quantitative signal of the same data as above, where rows were sorted by mean RNA-seq (proximal) or ATAC-seq (distal) signal. (C) Upset plots show colocalization of signal for proximal and distal regions for all four data types over all genotypes and stages. Regions common between data types (filled circle) are joined by a vertical bar. Horizontal bar plots indicate the number of unique genes/features. Pie charts indicate proportion of features with statistically different total read counts between time points (color indicates the number of times [0/1/2] the feature is differentially expressed).


