
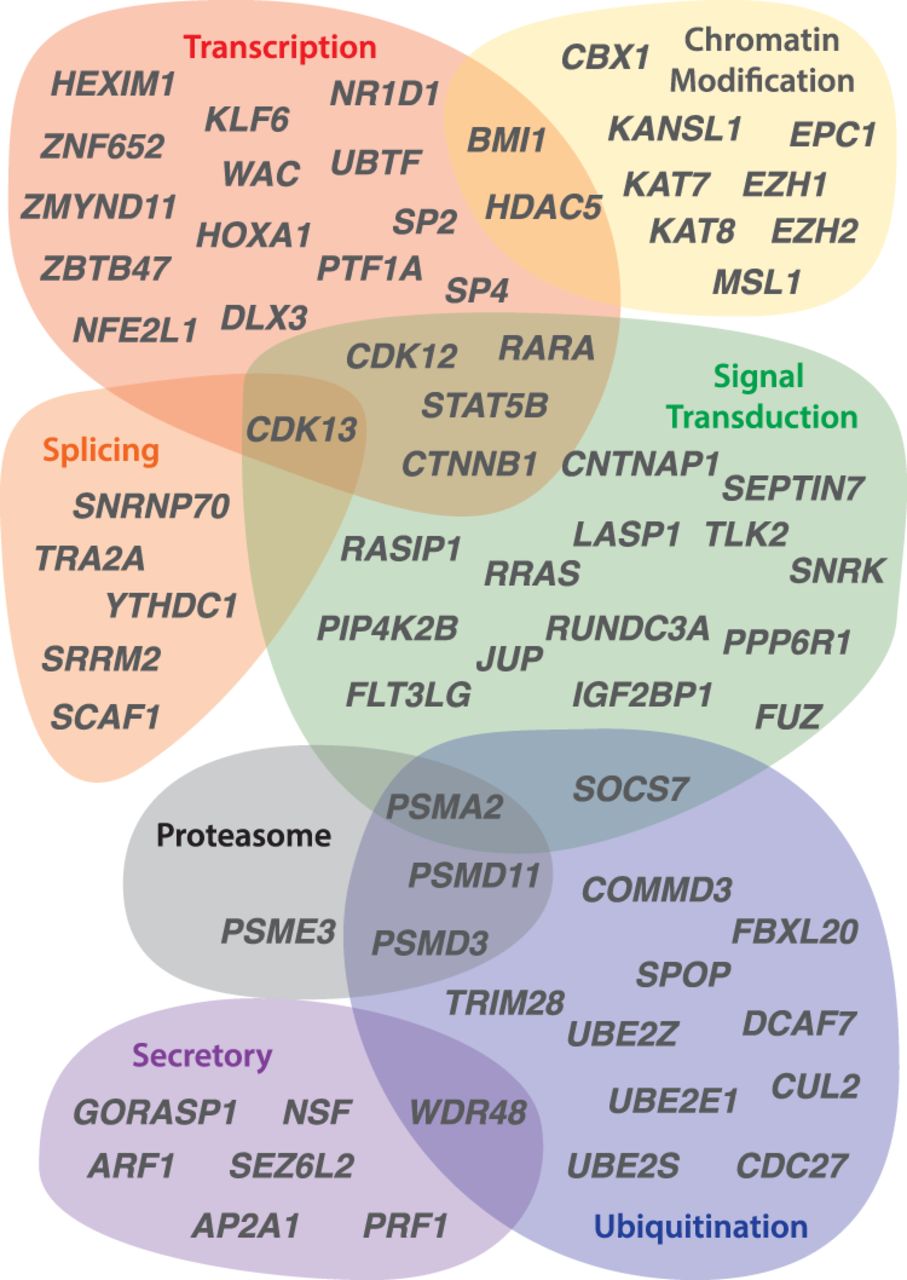
Figure 3.
Regulatory annotations of ancestral caenophidian Z–W gene pairs. The Euler diagram depicts regulatory functions predicted for genes from selected Z–W gene pairs on the basis of UniProt annotations of human orthologs. See also Supplemental Table S8.


