
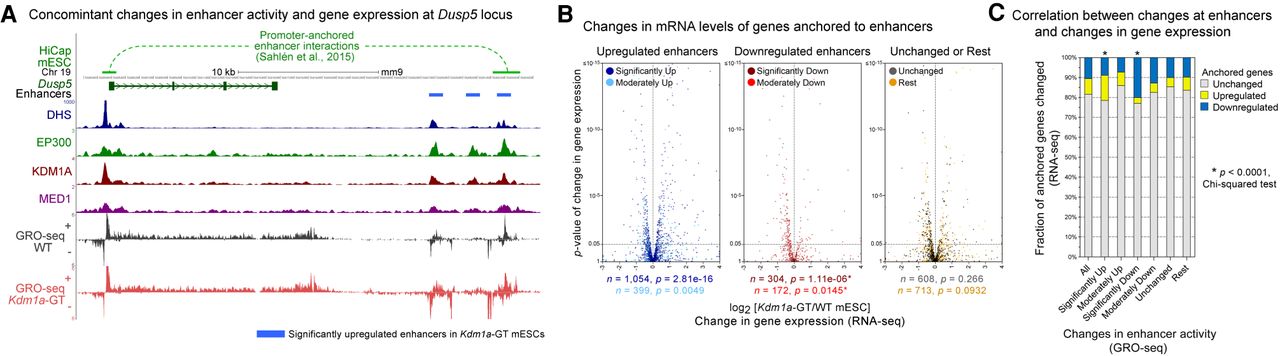
Aberrant changes in enhancer activity are associated with misregulation of physically interacting genes. (A) An example of long-range promoter-enhancer interactions (top track) obtained from the mESCs HiCap data set (Sahlén et al. 2015) at the Dusp5 locus. One of the three significantly up-regulated enhancers (blue bars) interacts with the Dusp5 promoter. Upon the loss of KDM1A, the gene and enhancers show up-regulation of H3K4me2, H3K27ac, and GRO-seq signals in Kdm1a-GT mESCs (red) compared with WT mESCs (gray). (B) Volcano plots of changes in mRNA levels (RNA-seq) of genes that physically interact with misregulated enhancers. On the basis of changes in enhancer-associated GRO-seq signals upon the loss of KDM1A, enhancers were subdivided as significantly up (q < 0.05, DESeq), significantly down, moderately up (0.05 ≤ q < 0.25), moderately down, unchanged (q ≥ 0.5 and fold-change ≤ 25%), and the rest. When multiple enhancers showed interactions with a single promoter, the assignment of the gene to an enhancer subgroup was prioritized in the aforementioned order. The total number of associated genes (n) and P-values (p) from Wilcoxon signed-rank tests on differences between mRNA levels in Kdm1a-GT and WT mESCs are shown beneath each panel. (C) χ2 test of the association of misregulated enhancers (GRO-seq) with the number of misregulated genes (RNA-seq). Significantly up- or down-regulated enhancers were more likely to be anchored to promoters of the genes that showed analogous up- or down-regulation in Kdm1a-GT mESCs. (*) P < 0.0001.


