
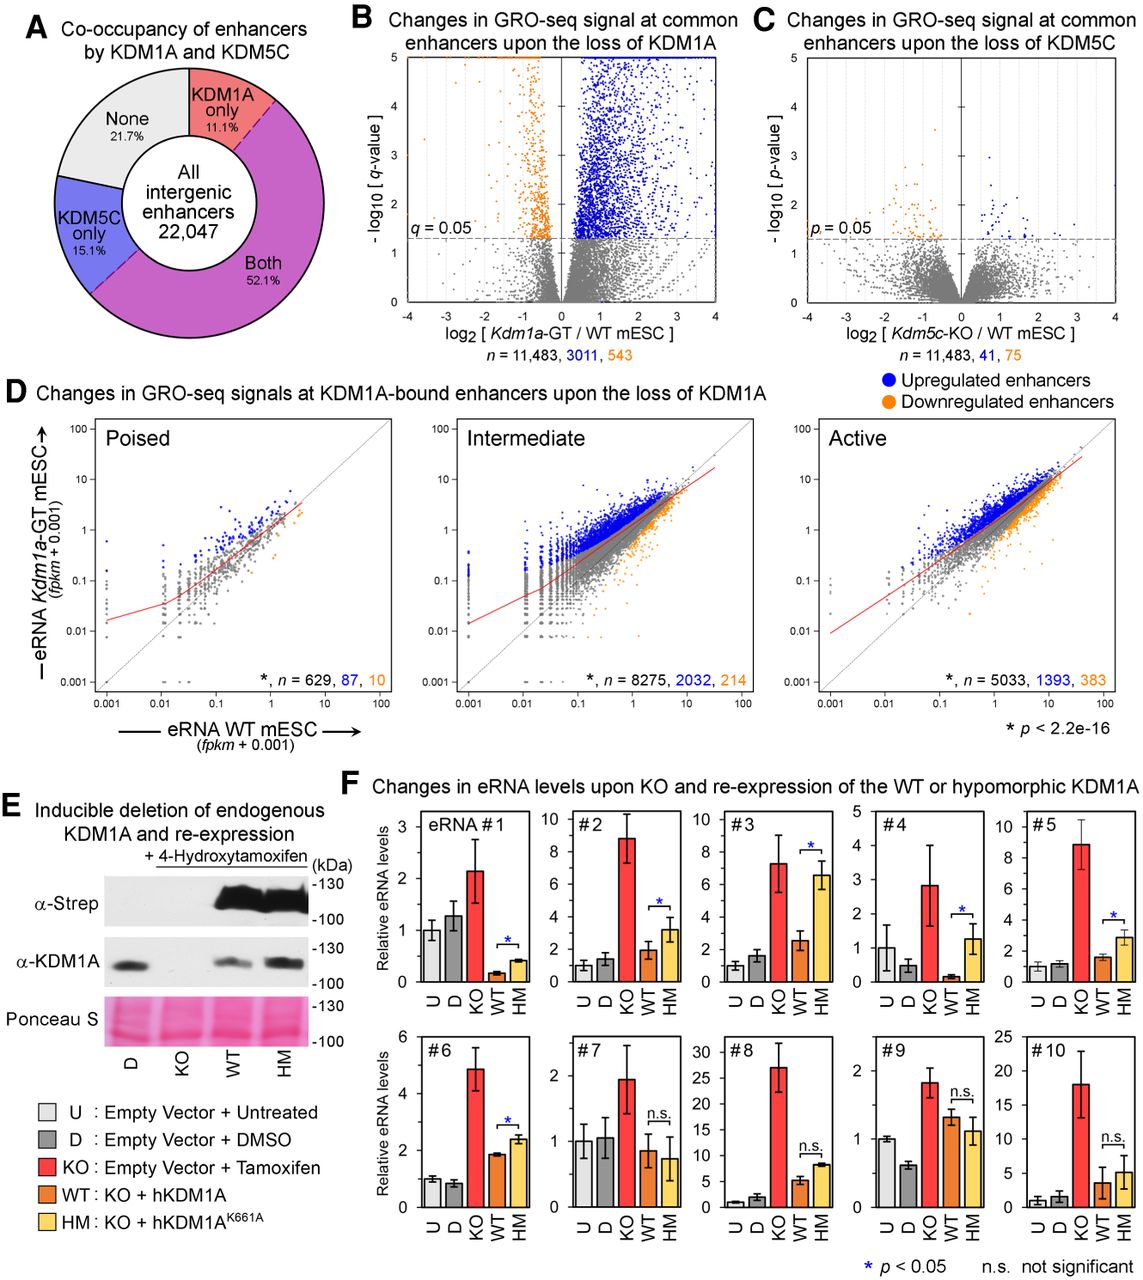
Loss of KDM1A but not KDM5C results in aberrant activation of enhancers. (A) Fractions of intergenic enhancers bound by KDM1A and/or KDM5C in mESCs. (B,C) Volcano plots of GRO-seq signals at enhancers bound by both KDM1A and KDM5C from DESeq analyses. Whereas the loss of KDM1A resulted in a large-scale increase in GRO-seq signals at enhancers, the deletion of KDM5C had a minimal impact. The x-axis and y-axis indicate the log2 fold-change and significance, respectively, of differential expression in WT and mutant mESC lines. (D) Scatterplots of GRO-seq levels at KDM1A-bound poised, intermediate, and active enhancers. Significantly up-regulated and down-regulated enhancers (q < 0.05, DESeq) are shown in blue and orange, respectively. The LOWESS curve for each class of enhancers is shown in red. The total number (n) of all, significantly up-regulated, and significantly down-regulated enhancers in each group are indicated in black, blue, and orange, respectively. Each class of enhancers shows a significant up-regulation (P < 2.2−16, Wilcoxon signed-rank test) in Kdm1a-GT mESCs compared with WT mESCs. (E) Western blot analysis to validate the re-expression of KDM1A-WT or the hypomorphic K661A mutant after inducible Kdm1a-KO in mESCs. (F) eRNA levels measured using RT-qPCR. Mean ± SEM (n = 4 biological replicates). (*) P < 0.05; Student's t-test, (n.s.) not significant. See Supplemental Table S4 for details of the enhancers.


