
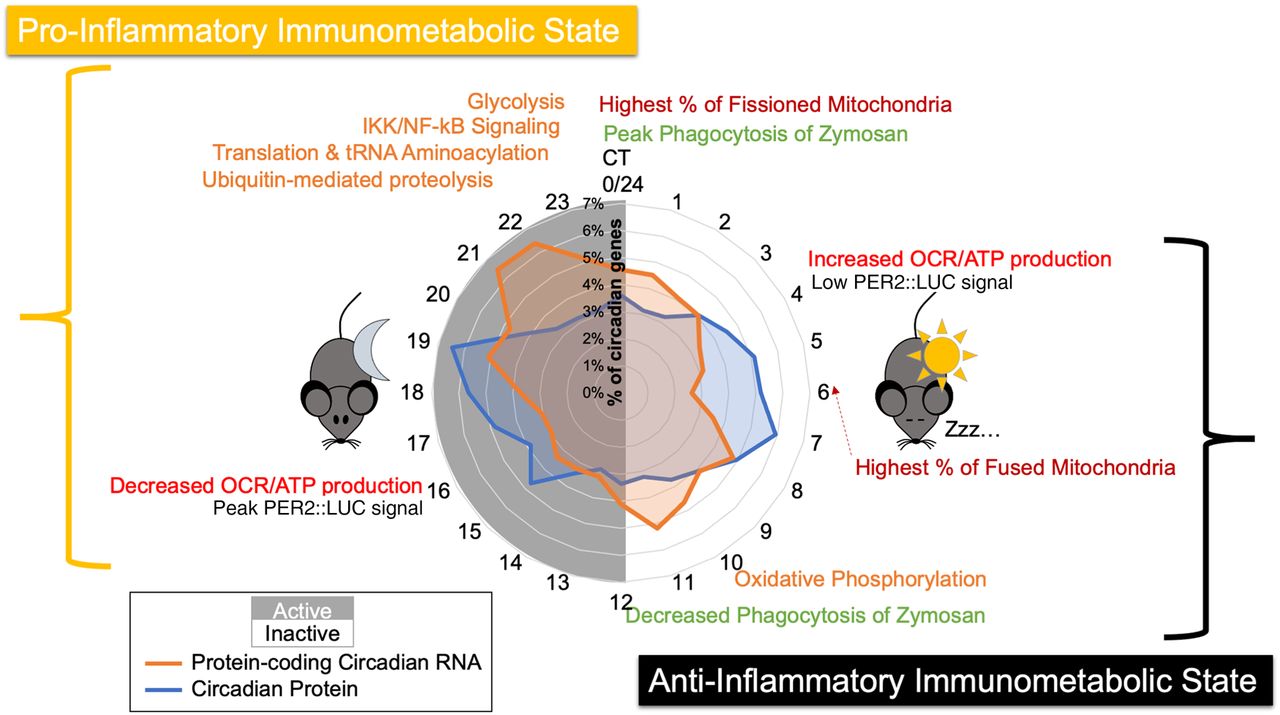
Summary model of the circadian regulation of distinct immunometabolic states. A summary schematic displaying key findings, spatially organized by circadian time of day, with a radial histogram in the center to indicate when circadian proteins and circadian mRNAs peak in abundance. Orange text represents enriched categories identified in the proteome, red represents the occurrence of mitochondrial morphology/functional observations, green represents phagocytosis assay observations, and black text shows the trough and peak of PER2 levels as determined by PER2::LUC luminescence signal. For reference, Post Shock 16, our first time course time point, is equivalent to CT4, as described in Figure 1D.


