
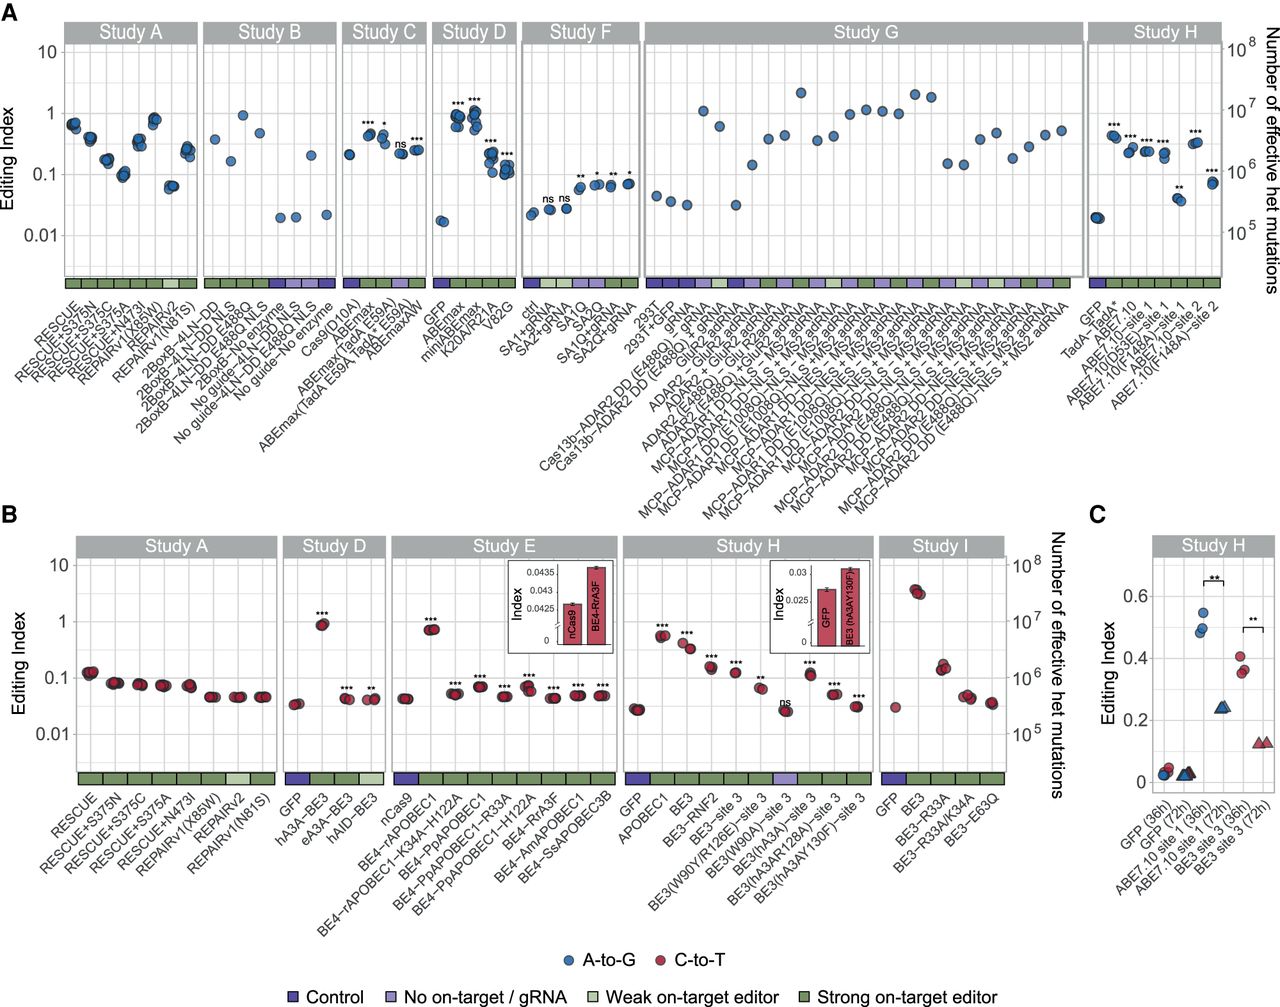
Editing activity is globally enhanced following introduction of base editors. The editing index is a global measure of editing activity, quantifying the fraction (percent) of the RNA nucleotides exhibiting a DNA-RNA mismatch (i.e., A-to-G index of 1 means that 1% of the RNA nucleotides mapped to a genomic adenine are guanosines). (A) For adenine base editors (Studies A, B, C, D, F, G, H), the A-to-G index (blue circles) per sample over the coding sequence is presented (see Supplemental Fig. S3 for whole-genome calculation). In almost all cases tested, the index is significantly elevated for base editors compared to the control samples. Two-sided t-test for log(index); (*) P < 0.05, (**) P < 0.01, (***) P < 0.001. Significance was not assessed for Study A (did not include untreated controls) and Studies B and G (only one replicate per condition). The two cases in Study F that do not show a significant difference exhibit weak on-target activity as well. In order to appreciate the significance of the high index values obtained, the index values are translated into an equivalent number of heterozygous mutations (Methods), right axis. Note that the index cannot be directly compared between samples of different reads’ lengths (Methods). (B) Same as A; C-to-U index (red) for cytidine deaminase samples (Studies A, D, E, H, I). (C) Samples sequenced 36 h posttreatment show a two- to threefold higher level of induced mutations compared to ones sequenced 72 h posttreatment (as are all samples in panels A,B). The data per sample are available in Supplemental Table S2. Exact P-values are presented in Supplemental Table S3.


