
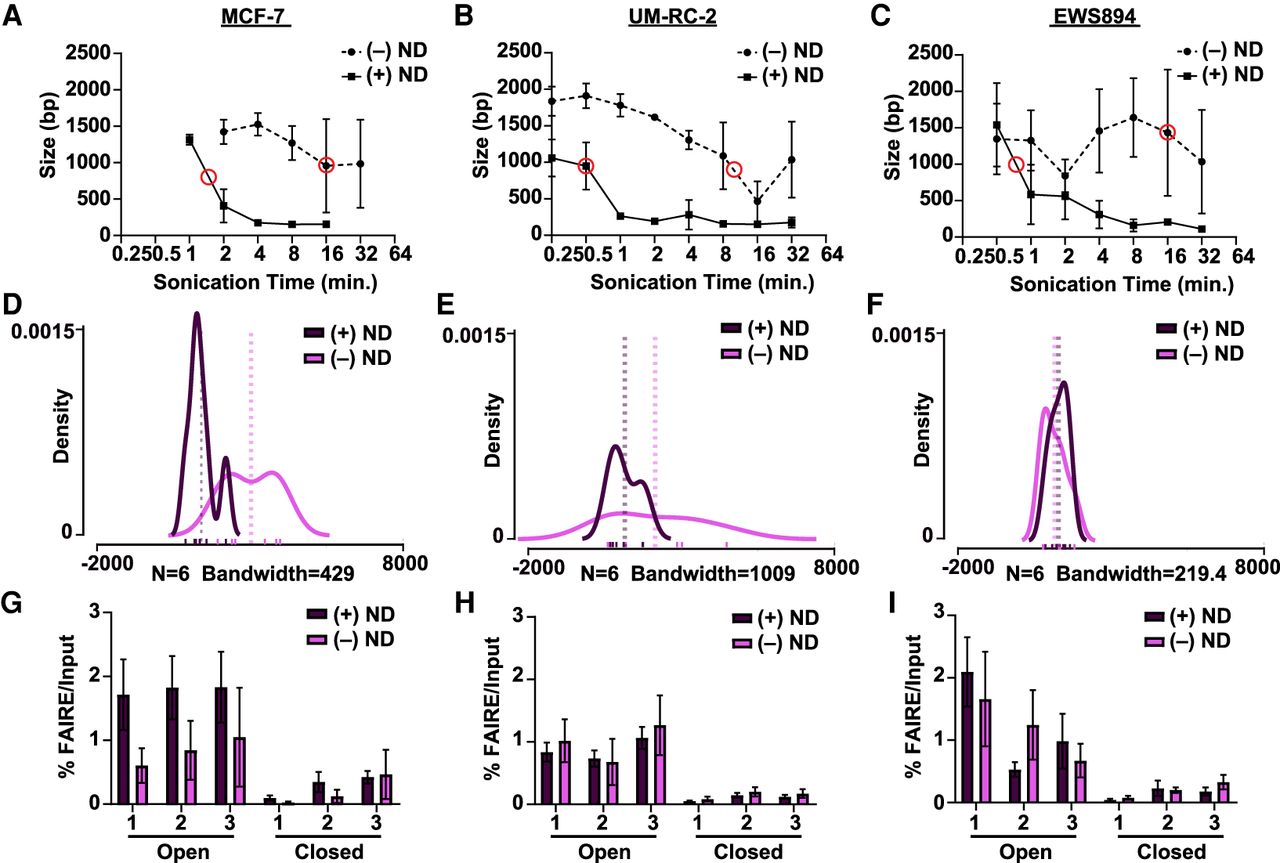
Nanodroplets facilitate extraction of high-quality chromatin from cross-linked cells. (A–C) Peak DNA fragment size (base pairs, y-axis) after sonication time (minutes, x-axis) for MCF-7, UM-RC-2, and EWS894cells (Agilent TapeStation 2200). Data represent the average of three biological replicate samples sonicated with (solid line) or without (dashed line) nanodroplets (ND). Red circles indicate the time point at which peak DNA size reached the target range of 750–1000 bp. (D–F) Density distribution of fragment sizes for FAIRE input DNA with and without nanodroplets from MCF-7, UM-RC-2, and EWS894 cells, respectively, at data points circled (in red) in A, B, and C, respectively. Actual fragment lengths for each of six replicates within each group delineated with rug plot beneath density plots (without nanodroplets, lavender; with nanodroplet, dark purple). Bandwidth for each density plot displayed beneath each graph. Average fragment length within each group per cell line is displayed by dotted vertical lines. (G–I) Percent FAIRE-qPCR signal over input with (dark purple) and without nanodroplets (lavender) from MCF-7, UM-RC-2, and EWS894 cells, respectively, at data points circled (in red) in A, B, C, respectively. (Open) regions of known accessible chromatin; (Closed) regions of known inaccessible chromatin.


