
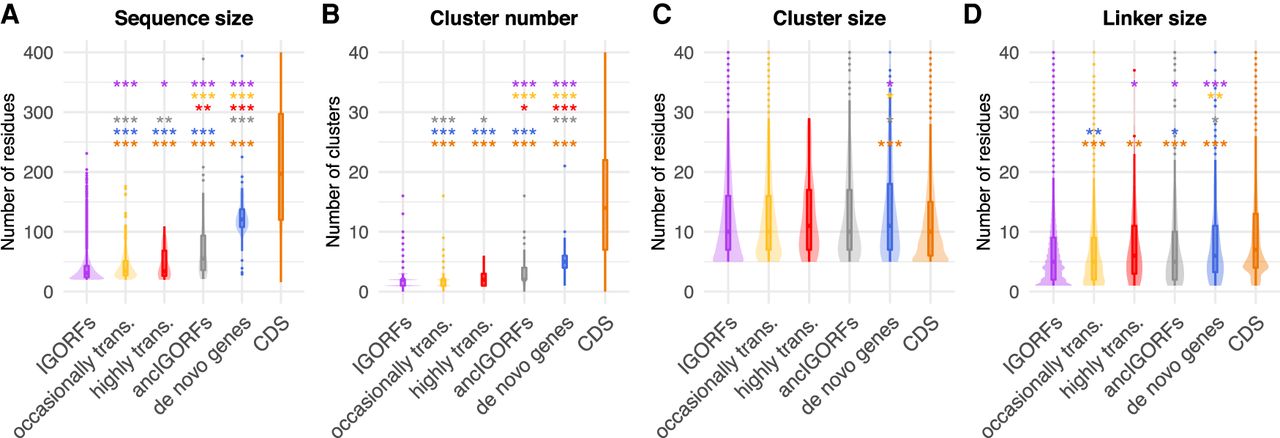
Continuum of sequence and structural properties between the different ORF categories. Comparison of the sequence size (A), cluster number (B), cluster sizes (C), and linker sizes (D) for each ORF category (IGORFs in purple, occasionally translated IGORFs in yellow, highly translated IGORFs in red, ancIGORFs in gray, de novo genes in blue, and CDSs in orange). The P-values were computed with the Mann–Whitney U test (one-sided for A,B,D and two-sided for C). Asterisks denote level of significance: (*) P < 5 × 10⁻², (**) P < 1 × 10⁻², (***) P < 1 × 10⁻³. For each plot, the color of the asterisks indicates the ORF category used for the comparison. The exact P-values are given in Supplemental Tables S1–S4.


