
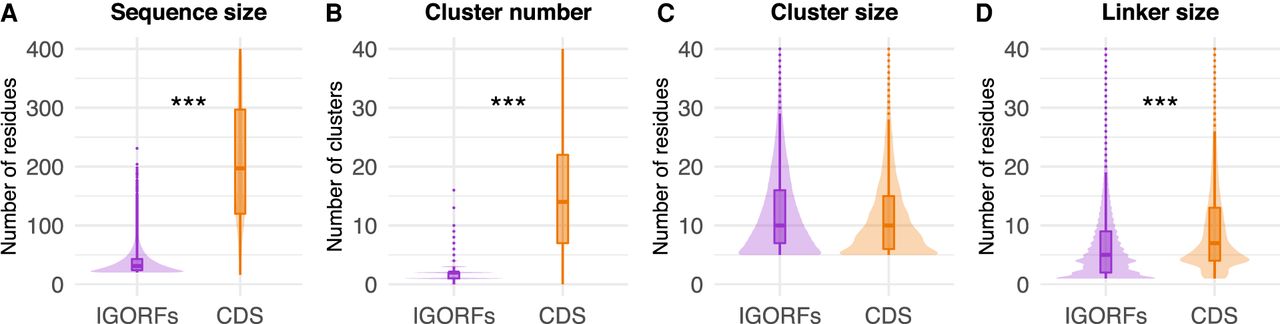
Figure 1.
Plots of the distributions of sequence and HCA-based structural properties of IGORFs and CDSs. Sequence size (A) and number of HCA clusters (B) per sequence. Size of HCA clusters (C) and size of linkers (D). The P-values were computed with the Mann–Whitney U test (one-sided for A,B,D, and two-sided for C). Asterisks denote level of significance: (***) P < 1 × 10⁻³; for detailed P-values, see Supplemental Tables S1–S4.


