
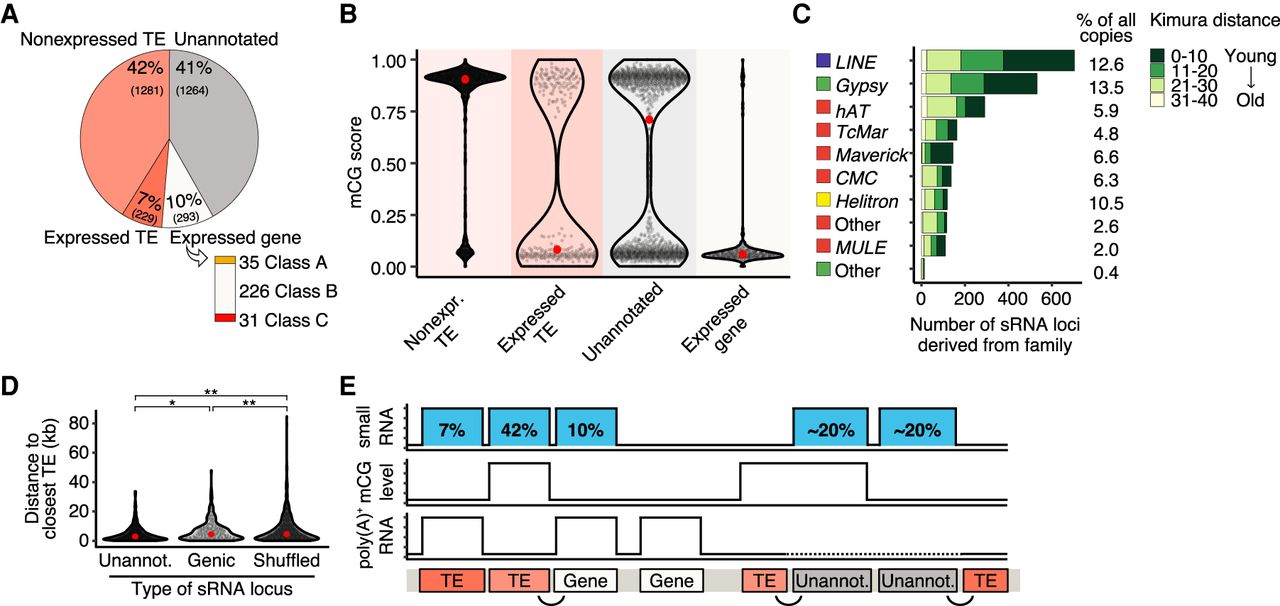
Genomic origin of small RNA–producing loci. (A) Genomic location of 3067 R. irregularis sRNA loci. The number of sRNA loci derived from nonexpressed and expressed TEs, unannotated regions, and genes is represented in a pie chart. Bar chart shows the number of genes of each class that produce sRNA. (B) mCG scores of expressed sRNA loci derived from nonexpressed TEs, expressed TEs, unannotated features, and expressed genes. Red dots represent the median mCG values of sRNAs from each feature. (C) Number of sRNA loci associated with different TE superfamilies. Percentage of TE copies from each superfamily that produce sRNA is shown on the right. Green color code indicates the relative age of sRNA-producing TEs, represented in Kimura distance bins between 0 and 40. Expressed sRNAs have been grouped into bins based on Kimura distance and hence relative age, represented using color coding. (D) Distance from sRNA loci derived from unannotated regions and expressed genes to closest known TE. Significance was assessed by a nonparametric Kruskal–Wallis test comparing the distance distribution of unannotated or genic sRNA loci to shuffled loci, respectively. A Kruskal–Wallis H test comparing unannotated and genic sRNA loci to shuffled loci was used to assess significance. (*) P = 2.8 × 10⁻⁶, (**) P < 2.2 × 10⁻¹⁶. (E) Schematic diagram of the genomic distribution of sRNA loci hypothesized due to data from this study of the R. irregularis genome, sRNAome, methylome, and transcriptome. sRNA loci, methylation levels, and RNA expression are displayed. The proportion of sRNA loci corresponding to each genomic context is indicated in blue boxes. Curvy lines highlight the proximity between TEs and genic and unannotated sRNA loci. Expression of unannotated regions was not analyzed and is represented by a dotted line.


