
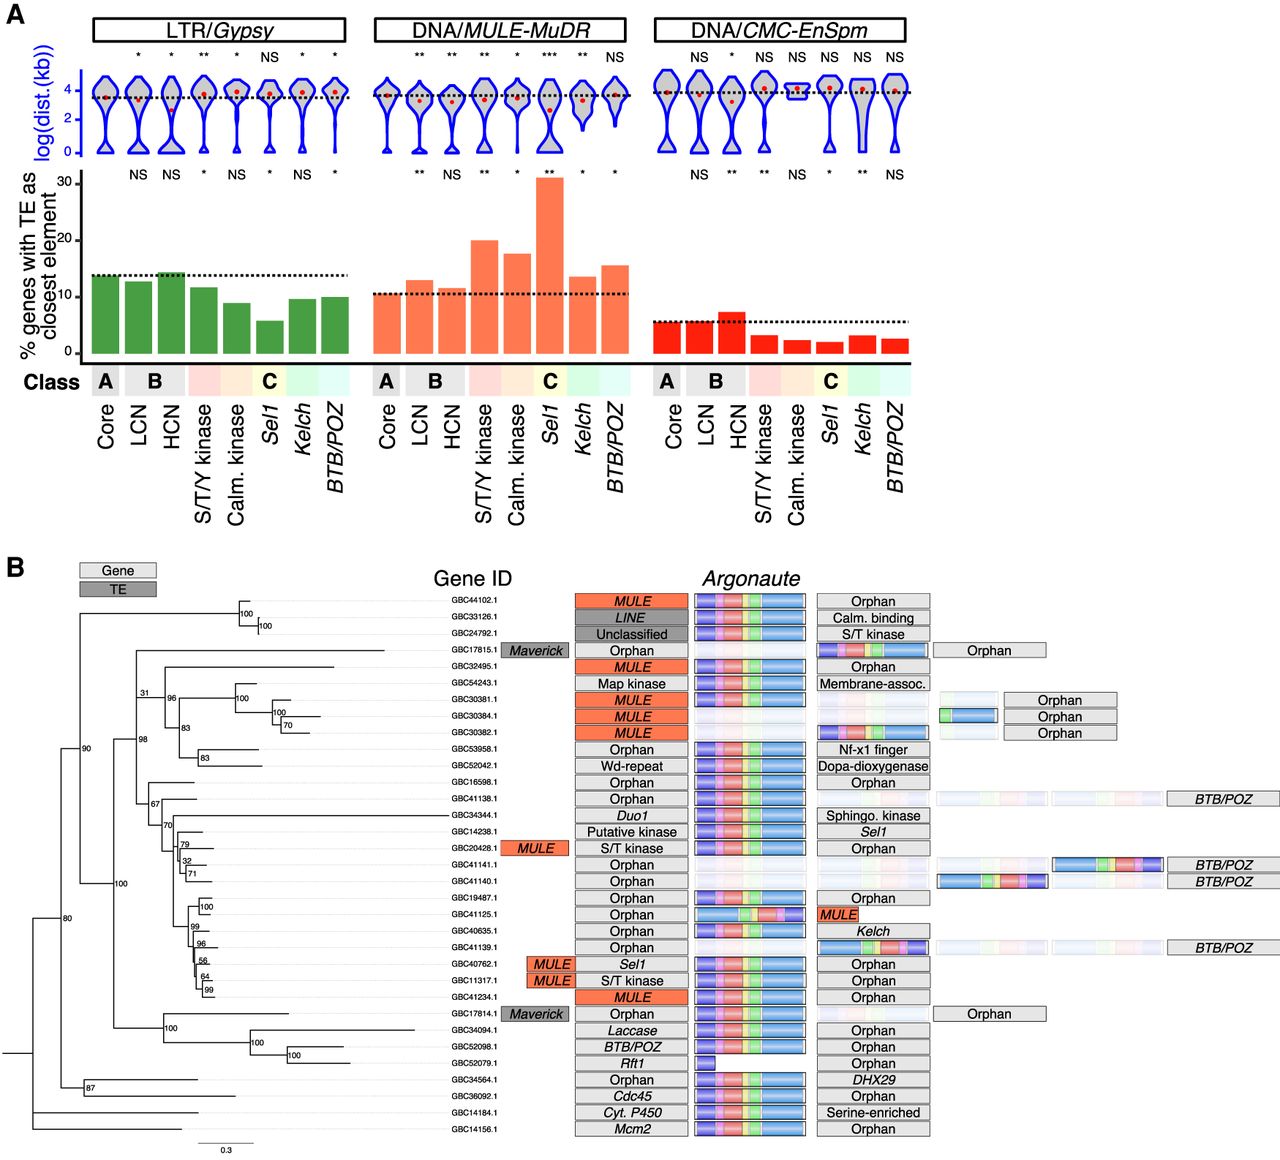
Location of genes relative to TEs. (A) Identity and distance of TEs closest to genes of classes A, B, and C. Top: log10-transformed distance (bp) between genes and closest TE of the displayed classes (Class A, B, and C genes, and LTR/Gypsy, DNA/MULE-MuDR, or DNA/CMC-EnSpm TEs). Class B genes are split into low and high copy number categories (LCN and HCN). Black dashed line highlights the median value of Class A. Significance was assessed via a Kruskal–Wallis H test comparing the distance distribution of each TE to repeated gene groups to Class A genes. (*) P-value <0.05, > 0.001. (**) P-value < 0.001. Bottom: proportion of genes of each class with a Gypsy, MULE-MuDR, or CMC-EnSpm element as their closest TE. Underrepresentation or enrichment significance of Class B and C genes was assessed by a Fisher's exact t-test comparing the occurrences of each TE class closest to genes of each family, compared to Class A core genes. (B) DNA-based phylogenetic tree and representation of the genomic context surrounding AGOgenes. Bootstrap values (100 replicates) are indicated. The class of closest genes and/or transposable elements are shown. MULEs are colored in red, repeat elements are dark gray, and genes are light gray. Colored regions on AGOgenes represent the six typical protein domains: N-terminal (purple), linker 1 (pink), PAZ (red), linker 2 (yellow), MID (green), and PIWI (blue).


