
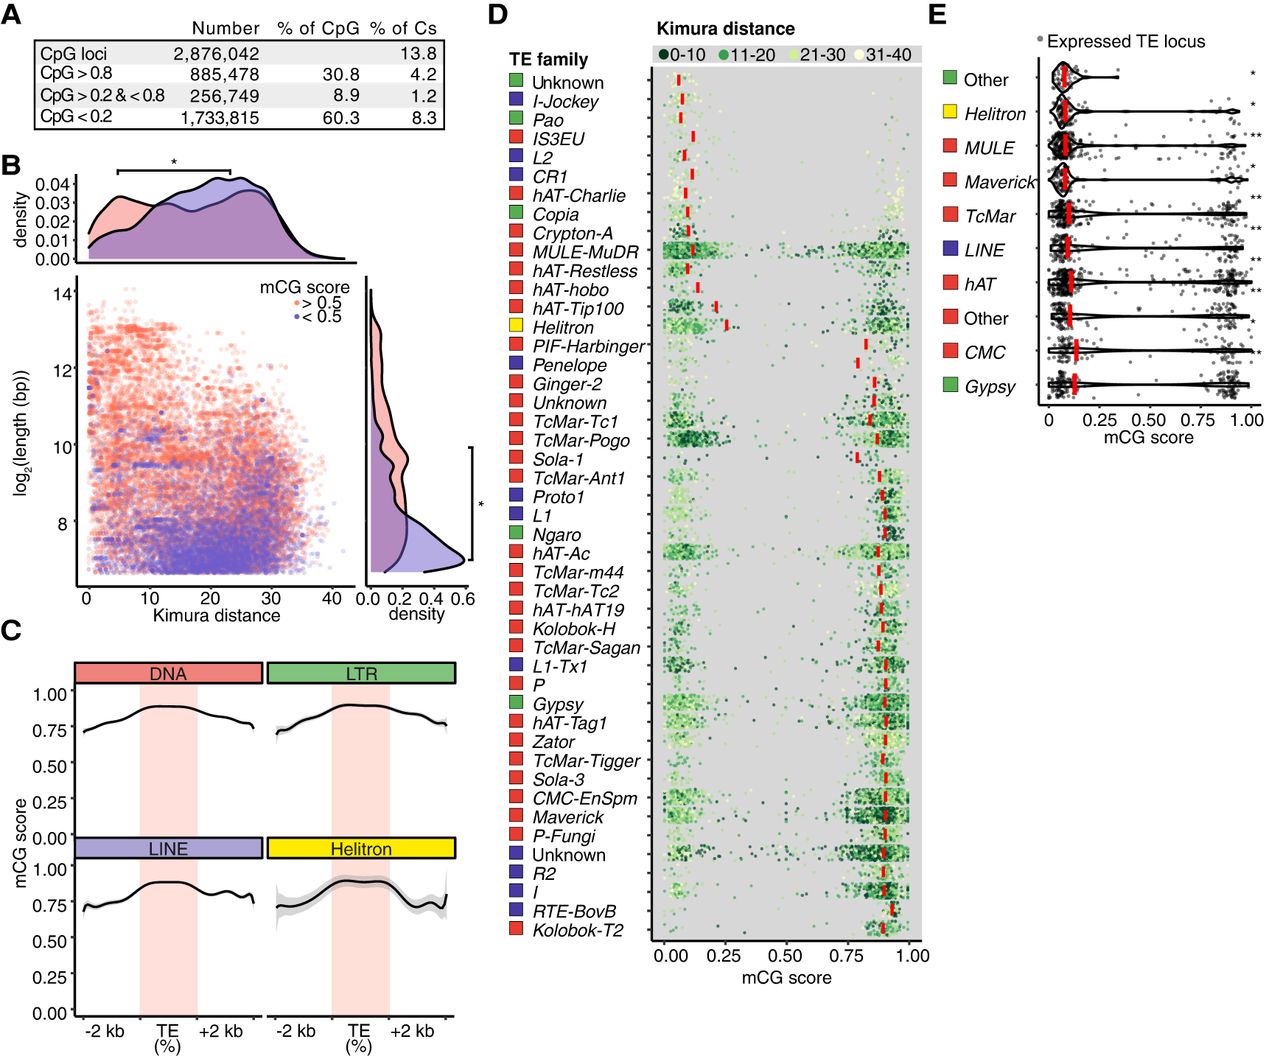
Interplay between transposons and DNA methylation in R. irregularis spores. (A) Absolute and relative proportions of mCG sites in R. irregularis spores. (B) Length of TE loci relative to divergence expressed as Kimura distance. Point color indicates high and low mCG score (pink and purple, respectively). Density plots depict TE length and divergence for elements belonging to each mCG score category. A Kruskal–Wallis H test was performed to compare the mCG score distributions of lowly and highly methylated TEs. (*) P-value < 2.2 × 10⁻¹⁶. (C) Metagene plots displaying mCG levels across the body, 2-kb upstream and downstream sequences of TE copies belonging to four TE superfamilies. (D) Average methylation (mCG score) of individual TE loci (length >100 bp and copy number >20), grouped into TE families. Red bars show the median values and point color indicates the relative age of each TE expressed as Kimura distance and grouped into bins. (E) mCG scores of expressed TEs. Red bars represent the median values of each superfamily. Significance was assessed by a Kruskal–Wallis H test comparing the mCG score distribution of expressed TEs to the mCG score distribution of nonexpressed TEs of the same class. (*) Kruskal–Wallis P-value < 1 × 10−36, > 1 × 10−100. (**) Kruskal–Wallis P-value < 1 × 10−100.


